Insurance claim statistics after major storms
What insurers reported to state regulators after the biggest recent disasters: how many claims, how much was paid, and how many closed with nothing paid.
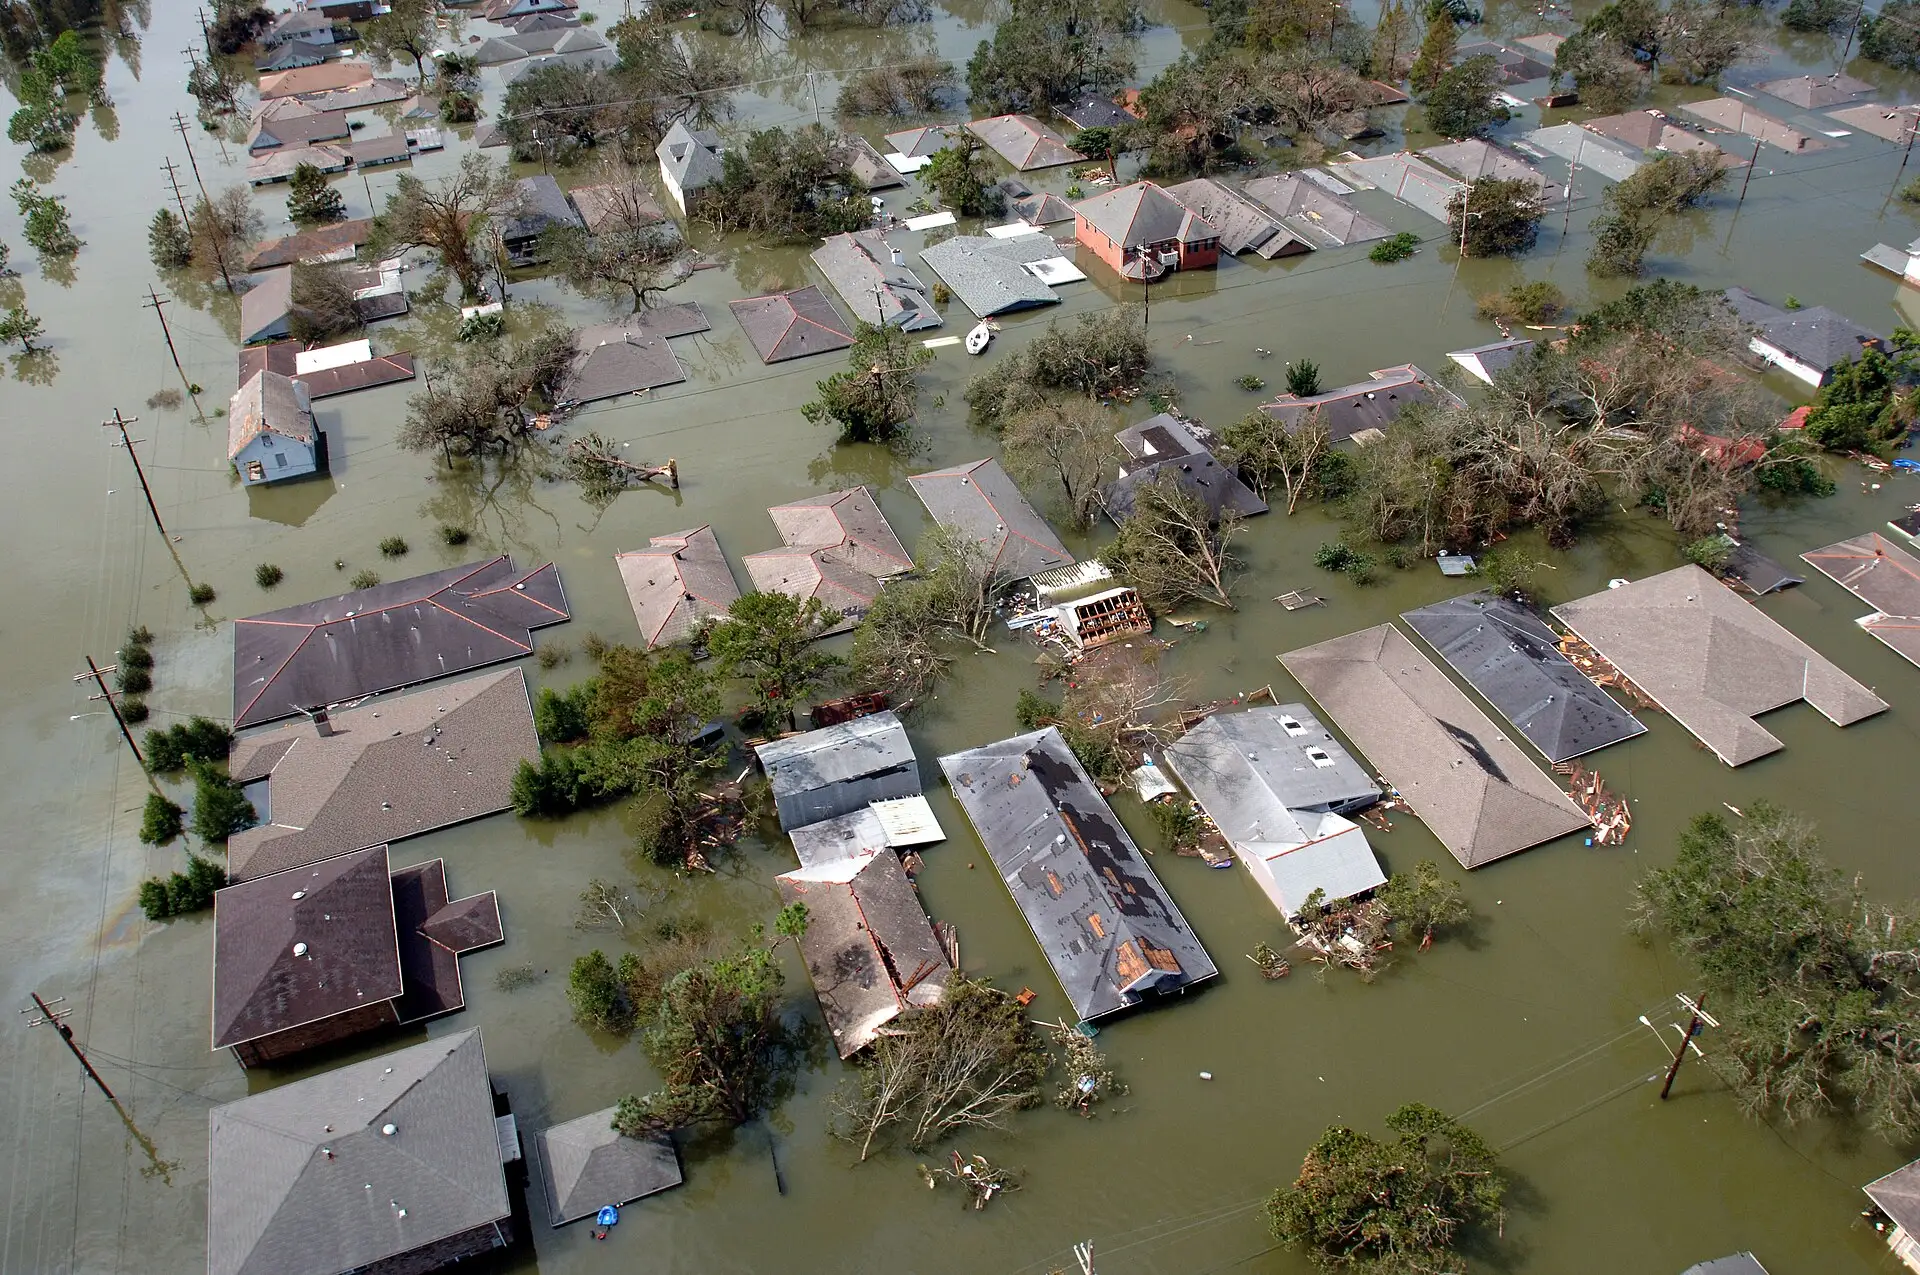
Photo: a flooded neighbourhood in New Orleans, Louisiana, August 2005. Jocelyn Augustino / FEMA, public domain. Use does not imply endorsement.

Claims filed, by event
- Hurricane Irma, Florida (2017) 1,125,588
- Hurricane Ian, Florida (2022) 789,066
- Hurricane Harvey, Texas (2017) 765,000
- Winter Storm Uri, Texas (2021) 511,473
- Hurricane Ida, Louisiana (2021) 460,709
- Hurricane Milton, Florida (2024) 385,146
- Hurricane Helene, Florida (2024) 155,182
- Hurricane Helene, North Carolina (2024) 125,658
- Hurricane Milton, Florida 35%
- Hurricane Irma, Florida 31%
- Hurricane Helene, North Carolina 26%
- Hurricane Ian, Florida 25%
- Hurricane Ida, Louisiana 23%
Florida
See also Florida storm and disaster data.
-
456,200
Residential property claims closed by Florida insurers in calendar year 2025, as reported to the state's closed-claim data call. · Calendar year 2025
Read with care: Insurer-reported; 170 companies filed data. Claims closed in 2025 may have been opened in earlier years. Many hurricane claims from earlier years are included. The data call collects public adjuster information, but the report publishes no public adjuster breakdown.
Florida Office of Insurance Regulation, Page 10 (show the source wording)
The source says“received data for a total of 456,200 unique”
Read it at the source (opens in a new tab) -
12.10% (53,413 of the claims with known status)
Share of Florida residential property claims closed in 2025 that were litigated, statewide (27.27% in Palm Beach, Broward and Miami-Dade; 8.16% in all other counties outside Central Florida). · Calendar year 2025
Read with care: The percentage is litigated claims divided by litigated plus non-litigated claims; claims with unreported litigation status are left out. Insurer-reported.
Florida Office of Insurance Regulation, Page 12, table 'Litigated and Non-Litigated Closed Claims Comparison' (show the source wording)
The source says“Statewide 7,707,052 53,413 387,931 12.10%”
Read it at the source (opens in a new tab) -
66 days average; 30 days median
Time Florida insurers took to close a residential property claim, across all perils, for claims closed in 2025. · Calendar year 2025
Read with care: Insurer-reported. Covers litigated and non-litigated claims together.
Florida Office of Insurance Regulation, Page 11 (show the source wording)
The source says“insurers to close a claim is 66 days, however, not all claims closed in greater than 60 days are a violation of Florida statutes. (the median number of days for insurers to close a claim is 30 days)”
Read it at the source (opens in a new tab) -
$15,257 vs $2,044
Average loss adjustment expense paid by Florida insurers on litigated residential property claims compared with non-litigated claims, for claims closed in 2025. · Calendar year 2025
Read with care: Insurer handling cost, not the amount paid to the policyholder. The non-litigated figure is on the next line of the report.
Florida Office of Insurance Regulation, Page 11 (show the source wording)
The source says“Average LAE paid across all perils for litigated claims: $15,257”
Read it at the source (opens in a new tab) -
732,390 closed; 58,395 litigated
Residential property claims closed by Florida insurers in calendar year 2022 and the number that were litigated, from the first year of the state's closed-claim data call. · Calendar year 2022
Read with care: Before the 2022-2023 legal reforms. 534,738 were reported as non-litigated, so litigation status was unreported for the rest.
Florida Office of Insurance Regulation, Page 1 (show the source wording)
The source says“Total number of reported claims closed in 2022: 732,390”
Read it at the source (opens in a new tab) -
14.9% of claims, 70.9% of litigation
Florida's share of United States homeowners claims and of homeowners claim litigation in 2022, from NAIC Market Conduct Annual Statement data as reported by Florida's regulator. · 2022
Read with care: Stated by the Florida regulator from NAIC data that is not fully public. Before the 2022-2023 legal reforms.
Florida Office of Insurance Regulation, Page 1 (show the source wording)
The source says“in 2022 Florida accounted for 14.9% percent of nationwide claims but had 70.9% of the nation's litigation.”
Read it at the source (opens in a new tab) -
8.16% of claims, 76.45% of suits
Florida's share of United States homeowners claims opened and homeowners lawsuits opened against insurers in 2019. · 2019
Read with care: Regulator's own aggregation of NAIC data. The 76.45% figure is in the following sentence of the letter. Predates Florida's 2022-2023 legal reforms.
Florida Office of Insurance Regulation, Page 1 (show the source wording)
The source says“in 2019, Florida accounted for 8.16% of all homeowners' claims opened by insurance companies in the U.S.”
Read it at the source (opens in a new tab) -
$34,969 vs $8,950
Average cost (loss plus allocated adjustment expense) of a closed Citizens homeowners water claim that was litigated compared with one that was not. · Claims closed 2012 through March 31, 2020
Read with care: Citizens only; Citizens is Florida's state-run insurer and its mix of claims differs from private insurers. Insurer cost, including the insurer's own legal expense; not what the policyholder kept. About litigation, not public adjusters.
Citizens Property Insurance Corporation (Florida), Page 21, table 'Citizens Litigated vs Non-Litigated Water Claim Costs' (show the source wording)
The source says“Grand Total $26,281 $8,687 $34,969 Grand Total $7,833 $1,116 $8,950”
Read it at the source (opens in a new tab) -
4,307
Lawsuits served on Citizens in the first nine months of 2025 (4,134 residential property), a 40% drop in the monthly rate from the same period of 2024. · January 1 to September 30, 2025
Read with care: Citizens only; Citizens is Florida's state-run insurer and its mix of claims differs from private insurers.
Citizens Property Insurance Corporation (Florida), Page 1 (show the source wording)
The source says“From January 2025 through September 2025, Citizens was served with 4,307 lawsuits”
Read it at the source (opens in a new tab) -
789,066
Total insurance claims reported from Hurricane Ian in Florida, all lines of business. · Data as of March 4, 2025
Read with care: Insurer-reported to the regulator, not audited. A snapshot: counts change as claims move through handling. Includes auto and other lines; residential property was 565,101.
Florida Office of Insurance Regulation, Ian Claims Data table, TOTALS row (cells separated by |) (show the source wording)
The source says“TOTALS | 789,066 | 22,765 | 11,314 | 554,213 | 200,774 | 95.7%”
Read it at the source (opens in a new tab) -
$22,235,966,358
Total estimated insured losses from Hurricane Ian in Florida. · Data as of March 4, 2025
Read with care: Insurer-reported to the regulator, not audited. A snapshot: counts change as claims move through handling. Estimated losses include case reserves and payments to date. Excludes federal flood insurance.
Florida Office of Insurance Regulation, Ian Claims Data section (show the source wording)
The source says“Total Estimated Insured Losses: $ 22,235,966,358.”
Read it at the source (opens in a new tab) -
200,774 of 789,066
Hurricane Ian claims in Florida closed without payment (residential property: 157,445 of 565,101). · Data as of March 4, 2025
Read with care: Insurer-reported to the regulator, not audited. A snapshot: counts change as claims move through handling. Closed without payment includes losses below the deductible, flood damage not covered by the policy, and duplicate or withdrawn claims, as well as denials.
Florida Office of Insurance Regulation, Ian Claims Data table, TOTALS and Residential Property rows (show the source wording)
The source says“Residential Property | 565,101 | 16,176 | 9,665 | 381,815 | 157,445 | 95.4%”
Read it at the source (opens in a new tab) -
385,146
Total insurance claims reported from Hurricane Milton in Florida, all lines of business. · Data as of December 9, 2025
Read with care: Insurer-reported to the regulator, not audited. A snapshot: counts change as claims move through handling. The page has typing errors in some cells (for example '3,7,67').
Florida Office of Insurance Regulation, Hurricane Milton Claims Data table, 'Number of Claims' row, TOTALS column (show the source wording)
The source says“Number of Claims | 304,408 | 242,719 | 30,466 | 27,456 | 3,7,67 | 23,901 | 2,046 | 466 | 1,388 | 43,397 | 385,146”
Read it at the source (opens in a new tab) -
$5,615,415,911
Total estimated insured losses from Hurricane Milton in Florida. · Data as of December 9, 2025
Read with care: Insurer-reported to the regulator, not audited. A snapshot: counts change as claims move through handling. Excludes federal flood insurance.
Florida Office of Insurance Regulation, Hurricane Milton Claims Data section (show the source wording)
The source says“Total Estimated Insured Losses : $ 5,615,415,911”
Read it at the source (opens in a new tab) -
134,177 of 385,146
Hurricane Milton claims in Florida closed without payment (residential property: 114,657 of 304,408). · Data as of December 9, 2025
Read with care: Insurer-reported to the regulator, not audited. A snapshot: counts change as claims move through handling. Closed without payment includes losses below the hurricane deductible and flood damage not covered by the policy, as well as denials.
Florida Office of Insurance Regulation, Hurricane Milton Claims Data table, 'Claims Closed Without Payment' row (show the source wording)
The source says“Claims Closed Without Payment | 114,657 | 95,845 | 11,927 | 5,476 | 1,409 | 7,206 | 504 | 114 | 332 | 8,946 | 134,177”
Read it at the source (opens in a new tab) -
155,182
Total insurance claims reported from Hurricane Helene in Florida, all lines of business. · Data as of June 10, 2025
Read with care: Insurer-reported to the regulator, not audited. A snapshot: counts change as claims move through handling. Residential property was 72,037; a large share of Helene claims were auto.
Florida Office of Insurance Regulation, Hurricane Helene Claims Data table, 'Number of Claims' row, TOTALS column (show the source wording)
The source says“Number of Claims | 72,037 | 57,992 | 6,550 | 6,617 | 878 | 7,137 | 4,344 | 146 | 1,424 | 62,578 | 155,182”
Read it at the source (opens in a new tab) -
$2,584,892,782
Total estimated insured losses from Hurricane Helene in Florida. · Data as of June 10, 2025
Read with care: Insurer-reported to the regulator, not audited. A snapshot: counts change as claims move through handling. Excludes federal flood insurance, which covered much of Helene's storm-surge damage.
Florida Office of Insurance Regulation, Hurricane Helene Claims Data section (show the source wording)
The source says“Total Estimated Insured Losses: $2,584,892,782”
Read it at the source (opens in a new tab) -
1,125,588
Total insurance claims reported from Hurricane Irma in Florida, all lines of business. · Data as of November 9, 2020
Read with care: Insurer-reported to the regulator, not audited. A snapshot: counts change as claims move through handling.
Florida Office of Insurance Regulation, Irma Claims Data table, TOTALS row (show the source wording)
The source says“TOTALS | 1,125,588 | 19,308 | 27,788 | 729,786 | 348,706 | 95.8%”
Read it at the source (opens in a new tab) -
$20,674,792,954
Total estimated insured losses from Hurricane Irma in Florida. · Data as of November 9, 2020
Read with care: Insurer-reported to the regulator, not audited. A snapshot: counts change as claims move through handling.
Florida Office of Insurance Regulation, Irma Claims Data section (show the source wording)
The source says“Total Estimated Insured Losses: $20,674,792,954”
Read it at the source (opens in a new tab) -
348,706 of 1,125,588
Hurricane Irma claims in Florida closed without payment (residential property: 293,136 of 955,852). · Data as of November 9, 2020
Read with care: Insurer-reported to the regulator, not audited. A snapshot: counts change as claims move through handling. Closed without payment includes losses below the hurricane deductible as well as denials.
Florida Office of Insurance Regulation, Irma Claims Data table, Residential Property row (show the source wording)
The source says“Residential Property | 955,852 | 17,164 | 25,900 | 619,652 | 293,136 | 95.5%”
Read it at the source (opens in a new tab) -
158,991 claims; $9,132,526,254
Total insurance claims and estimated insured losses from Hurricane Michael in Florida. · Data as of November 2, 2020
Read with care: Insurer-reported to the regulator, not audited. A snapshot: counts change as claims move through handling. The loss total appears on the page as 'Total Estimated Insured Losses: $9,132,526,254'.
Florida Office of Insurance Regulation, Michael Claims Data table, TOTALS row (show the source wording)
The source says“TOTALS | 158,991 | 6,526 | 1,046 | 129,656 | 21,763 | 95.2%”
Read it at the source (opens in a new tab) -
25,047 claims; $309,530,946
Total insurance claims and estimated insured losses from Hurricane Idalia in Florida. · Data as of November 16, 2023
Read with care: Insurer-reported to the regulator, not audited. A snapshot: counts change as claims move through handling. Only 75.6% of claims were closed at this date, the last update published.
Florida Office of Insurance Regulation, Idalia Claims Data table, TOTALS row (show the source wording)
The source says“TOTALS | 25,047 | 3,194 | 2,927 | 11,543 | 7,383 | 75.6%”
Read it at the source (opens in a new tab) -
34.16%
Share of homeowners claims closed during the year that were closed without any payment. Statewide industry ratio for FL. · Data year 2025
Read with care: Ratios are built from insurer filings to state regulators. The Florida figure does not include Citizens Property Insurance Corporation. The workbook has no national average row. Not every insurer files: small writers are exempt. Closed without payment includes losses below the deductible. The quote is the ratio's definition in the workbook; the number is the cell value for the state.
National Association of Insurance Commissioners (NAIC), Sheet 'HO', block 'Ratio 1', row FL*, column 'State Ratio' (show the source wording)
The source says“Ratio 1: Claims closed without payment to the total claims closed.”
Read it at the source (opens in a new tab) -
41.65%
Share of paid homeowners claims that were paid more than 60 days after the claim was reported. Statewide industry ratio for FL. · Data year 2025
Read with care: Ratios are built from insurer filings to state regulators. The Florida figure does not include Citizens Property Insurance Corporation. The workbook has no national average row. Not every insurer files: small writers are exempt. The quote is the ratio's definition in the workbook; the number is the cell value for the state.
National Association of Insurance Commissioners (NAIC), Sheet 'HO', block 'Ratio 3', row FL*, column 'State Ratio' (show the source wording)
The source says“Ratio 3: Percentage of claims paid beyond 60 days.”
Read it at the source (opens in a new tab) -
14.28%
Lawsuits opened against homeowners insurers during the year, as a proportion of claims closed without payment. A rough gauge of how litigated a state's homeowners claims are. Statewide industry ratio for FL. · Data year 2025
Read with care: Ratios are built from insurer filings to state regulators. The Florida figure does not include Citizens Property Insurance Corporation. The workbook has no national average row. Not every insurer files: small writers are exempt. The quote is the ratio's definition in the workbook; the number is the cell value for the state.
National Association of Insurance Commissioners (NAIC), Sheet 'HO', block 'Ratio 7', row FL*, column 'State Ratio' (show the source wording)
The source says“Ratio 7: Suits opened during the period to claims closed without payment.”
Read it at the source (opens in a new tab) -
448,618
National Flood Insurance Program claim records for FL in FEMA's public claims dataset. · Losses 1978 to 2026; dataset as served November 10, 2026
Read with care: Counted this session through the OpenFEMA API; the quote is the API's record count for our query. One record per NFIP claim transaction in the redacted dataset, all years since 1978. Federal flood insurance only; not homeowners insurance.
Federal Emergency Management Agency (OpenFEMA), API metadata 'count' for $filter=state eq 'FL' (show the source wording)
Texas
See also Texas storm and disaster data.
-
about 765,000
Insurance claims generated by Hurricane Harvey in Texas across all personal and commercial lines (about 412,000 residential property and 211,000 automobile). · Data through December 31, 2018
Read with care: Insurer-reported to TDI and not audited. Includes private insurers, TWIA and the Texas FAIR Plan, and federal flood claims only where sold through private 'Write Your Own' insurers.
Texas Department of Insurance, Executive Summary, PDF page 5 (show the source wording)
The source says“As of December 31, 2018, Hurricane Harvey generated about 765,000 claims to private insurers, TWIA, and the Texas FAIR Plan Association for all personal and commercial lines of insurance.”
Read it at the source (opens in a new tab) -
about $16.8 billion paid; about $20 billion expected
Claim payments made for Hurricane Harvey in Texas and insurers' estimate of the eventual total. · Data through December 31, 2018
Read with care: Insurer-reported to TDI and not audited. Includes private insurers, TWIA and the Texas FAIR Plan, and federal flood claims only where sold through private 'Write Your Own' insurers. Most of the dollars were flood and commercial property, not homeowners policies.
Texas Department of Insurance, Executive Summary, PDF page 5 (show the source wording)
The source says“insurers have made about $16.8 billion in claim payments (paid losses). Insurers estimate they will ultimately pay out a total of about $20 billion.”
Read it at the source (opens in a new tab) -
98 percent (749,000 claims)
Share of Hurricane Harvey claims in Texas that insurers had closed 16 months after the storm. · Data through December 31, 2018
Read with care: Insurer-reported to TDI and not audited. Includes private insurers, TWIA and the Texas FAIR Plan, and federal flood claims only where sold through private 'Write Your Own' insurers.
Texas Department of Insurance, Executive Summary, PDF page 5 (show the source wording)
The source says“insurers have closed 749,000 claims, which is 98 percent of all claims.”
Read it at the source (opens in a new tab) -
60 days
Average time to close a residential property claim from Hurricane Harvey in Texas. · Claims closed as of December 31, 2018
Read with care: Insurer-reported to TDI and not audited. Includes private insurers, TWIA and the Texas FAIR Plan, and federal flood claims only where sold through private 'Write Your Own' insurers. Some surplus lines insurers were excluded from this average.
Texas Department of Insurance, PDF page 24 (Residential Property Data by Region) (show the source wording)
The source says“For residential property claims closed as of December 31, 2018, it took an average of 60 days to close a claim.”
Read it at the source (opens in a new tab) -
61 percent (ACV policies) vs 55 percent (RCV policies)
Share of Hurricane Harvey residential property claims in Texas closed without payment, by whether the policy paid actual cash value or replacement cost. · Data through December 31, 2018
Read with care: Insurer-reported to TDI and not audited. Includes private insurers, TWIA and the Texas FAIR Plan, and federal flood claims only where sold through private 'Write Your Own' insurers. More than half of residential claims closed without payment largely because Harvey's damage was flooding, which homeowners policies usually do not cover; TDI notes some people filed only to get a denial needed for FEMA aid.
Texas Department of Insurance, Executive Summary, PDF page 10 (detail on page 25) (show the source wording)
The source says“Policies with ACV coverage had a higher percentage of claims closed without payment (61 percent for ACV policies versus 55 percent for RCV policies)”
Read it at the source (opens in a new tab) -
511,473
Insurance claims reported from the February 2021 Texas winter storm (Winter Storm Uri), all lines. · As of June 30, 2022
Read with care: Insurers reporting cover about 94% of the Texas property market. Excludes liability and collision auto claims.
Texas Department of Insurance, Page 3 (show the source wording)
The source says“As of June 30, 2022, reporting insurers indicated they had 511,473 insurance claims”
Read it at the source (opens in a new tab) -
about $11.5 billion expected; $8.8 billion paid
Insured losses insurers expected to pay for the February 2021 Texas winter storm, and the amount paid to policyholders so far. · As of June 30, 2022
Read with care: Insurer estimates. The $8.8 billion paid figure is in the following sentence. About 94% of the property market reporting.
Texas Department of Insurance, Page 3 (show the source wording)
The source says“expected to ultimately pay about $11.5 billion in insured Texas losses from this event”
Read it at the source (opens in a new tab) -
59.4% closed with payment; 38.0% closed without payment
Outcome of insurance claims from the February 2021 Texas winter storm 16 months after the event. · As of June 30, 2022
Read with care: All lines combined. The 38.0% closed-without-payment figure is in the same sentence of the report. Closed without payment includes losses below the deductible.
Texas Department of Insurance, Page 3 (show the source wording)
The source says“59.4% were closed with a payment to the policyholder”
Read it at the source (opens in a new tab) -
61.4 days
Average time insurers took to close a residential property claim from the February 2021 Texas winter storm (64.1 days on replacement cost policies; 42.3 days on actual cash value policies). · Claims closed by June 30, 2022
Read with care: Average of closed claims only; the roughly 1.2% of residential claims still open are not in it.
Texas Department of Insurance, Page 3 (show the source wording)
The source says“For residential property claims that were closed by June 30, 2022, on average insurers closed a claim after 61.4 days”
Read it at the source (opens in a new tab) -
about $17,800
Average incurred loss on a residential property claim from the February 2021 Texas winter storm. · As of June 30, 2022
Read with care: Incurred loss is payments plus reserves. An average across all residential claims with a loss.
Texas Department of Insurance, Page 3 (show the source wording)
The source says“The average incurred loss was about $17,800 for residential property policies”
Read it at the source (opens in a new tab) -
nearly 76,500 claims; about $1.17 billion paid
Hurricane Harvey claims received by the Texas Windstorm Insurance Association and the amount it had paid, one year after the storm. · As of August 31, 2018
Read with care: TWIA only (the state-created wind insurer for the Texas coast). Rounded figures in a narrative report.
Texas Windstorm Insurance Association, PDF page 7 (show the source wording)
The source says“As of August 31, 2018, TWIA has received nearly 76,500 claims and issued approximately $1.17 billion dollars in claim payments.”
Read it at the source (opens in a new tab) -
4.88% disputed; 0.28% complaints
Share of TWIA's Hurricane Harvey claims that were disputed, and the share that led to a complaint. · As of August 31, 2018
Read with care: TWIA only. The sentence reads 'complaint and dispute ratios as a percentage of all claims received for Hurricane Harvey remain low at approximately 0.28% and 4.88%, respectively.' The report gives no figure for public adjuster involvement.
Texas Windstorm Insurance Association, PDF page 7 (show the source wording)
The source says“approximately 0.28% and 4.88%, respectively.”
Read it at the source (opens in a new tab) -
$10,800 to $28,500 more
How much more the appraisal award was than the insurer's initial offer for the middle half of Texas residential property appraisals (average about $22,600 more). · Claims in the three years July 2020 to June 2023
Read with care: From 12 insurer groups covering about 69% of the Texas residential market; over 80% of the appraisals came from two groups. Covers only claims that went to appraisal, which is under 2% of payable claims. Does not account for the policyholder's appraiser and umpire costs.
Texas Department of Insurance, Page 11, 'Awards compared to initial offer' (summary bullet on page 8) (show the source wording)
The source says“Residential property awards averaged about $22,600 more than the insurer's initial offer. About half of the awards were $10,800 to $28,500 more than the initial offer.”
Read it at the source (opens in a new tab) -
about 99%
Share of Texas residential property appraisals that were started by the claimant rather than the insurer. · Claims in the three years July 2020 to June 2023
Read with care: 12 insurer groups, about 69% of the Texas residential market.
Texas Department of Insurance, Page 8 (show the source wording)
The source says“it was initiated by the claimant for about 99% of residential property appraisals and 94% of personal auto appraisals.”
Read it at the source (opens in a new tab) -
less than 2%
Share of payable Texas residential property claims in which appraisal was used. · Claims in the three years July 2020 to June 2023
Read with care: 12 insurer groups, about 69% of the Texas residential market. Use grew from about 1.2% to 2.3% over the three years.
Texas Department of Insurance, Page 8 (show the source wording)
The source says“Appraisal was used in less than 2% of all payable residential property claims and less than 0.02% of payable personal auto claims.”
Read it at the source (opens in a new tab) -
10.9% falling to 0.9%
Share of Texas residential property appraisals that were followed by a lawsuit, first reporting year compared with third. · July 2020-June 2021 compared with July 2022-June 2023
Read with care: 12 insurer groups. Later years had less time for a lawsuit to be filed, which can make the latest figure look lower than it will end up.
Texas Department of Insurance, Page 8 (show the source wording)
The source says“Lawsuits filed after an appraisal decreased from 10.9% to 0.9%.”
Read it at the source (opens in a new tab) -
30.45%
Share of homeowners claims closed during the year that were closed without any payment. Statewide industry ratio for TX. · Data year 2025
Read with care: Ratios are built from insurer filings to state regulators. The Florida figure does not include Citizens Property Insurance Corporation. The workbook has no national average row. Not every insurer files: small writers are exempt. Closed without payment includes losses below the deductible. The quote is the ratio's definition in the workbook; the number is the cell value for the state.
National Association of Insurance Commissioners (NAIC), Sheet 'HO', block 'Ratio 1', row TX, column 'State Ratio' (show the source wording)
The source says“Ratio 1: Claims closed without payment to the total claims closed.”
Read it at the source (opens in a new tab) -
20.04%
Share of paid homeowners claims that were paid more than 60 days after the claim was reported. Statewide industry ratio for TX. · Data year 2025
Read with care: Ratios are built from insurer filings to state regulators. The Florida figure does not include Citizens Property Insurance Corporation. The workbook has no national average row. Not every insurer files: small writers are exempt. The quote is the ratio's definition in the workbook; the number is the cell value for the state.
National Association of Insurance Commissioners (NAIC), Sheet 'HO', block 'Ratio 3', row TX, column 'State Ratio' (show the source wording)
The source says“Ratio 3: Percentage of claims paid beyond 60 days.”
Read it at the source (opens in a new tab) -
1.91%
Lawsuits opened against homeowners insurers during the year, as a proportion of claims closed without payment. A rough gauge of how litigated a state's homeowners claims are. Statewide industry ratio for TX. · Data year 2025
Read with care: Ratios are built from insurer filings to state regulators. The Florida figure does not include Citizens Property Insurance Corporation. The workbook has no national average row. Not every insurer files: small writers are exempt. The quote is the ratio's definition in the workbook; the number is the cell value for the state.
National Association of Insurance Commissioners (NAIC), Sheet 'HO', block 'Ratio 7', row TX, column 'State Ratio' (show the source wording)
The source says“Ratio 7: Suits opened during the period to claims closed without payment.”
Read it at the source (opens in a new tab) -
394,204
National Flood Insurance Program claim records for TX in FEMA's public claims dataset. · Losses 1978 to 2026; dataset as served November 10, 2026
Read with care: Counted this session through the OpenFEMA API; the quote is the API's record count for our query. One record per NFIP claim transaction in the redacted dataset, all years since 1978. Federal flood insurance only; not homeowners insurance.
Federal Emergency Management Agency (OpenFEMA), API metadata 'count' for $filter=state eq 'TX' (show the source wording)
Complaints to the regulator
-
4,867
Complaints received by the Texas Department of Insurance in 2025 with coverage type Homeowners (5,478 in 2024; 4,190 in 2023; 3,047 in 2022; 3,831 in 2021). · Calendar year 2025
Read with care: Counted this session through the portal's API; the quote is the API's answer to our query. Complaints received, whether or not TDI confirmed them. 2026 through November 2: 3,352.
Texas Department of Insurance (Texas Open Data Portal), API query: count where coverage_type = 'Homeowners', grouped by year of received_date (show the source wording)
-
843
Most common reason combination on Texas homeowners complaints received in 2025: customer service claim handling, delays and unsatisfactory settlement or offer together. Next: claim handling plus delays (779). · Calendar year 2025
Read with care: Counted this session through the portal's API. TDI stores several reasons in one field, so totals by single reason need the field split first.
Texas Department of Insurance (Texas Open Data Portal), API query: distinct complaint_number where coverage_type = 'Homeowners' and year = 2025, grouped by reason (show the source wording)
The source says“{"reason":"Cust Service Claim Handling; Delays (Claims Handling); Unsatisfactory Settle/Offer","n":"843"}”
Read it at the source (opens in a new tab) -
19,607
Insurance complaints resolved by the Texas Department of Insurance in fiscal year 2025, all lines (18,576 in fiscal year 2024). · Fiscal years 2024-2025
Read with care: All lines of insurance, not only homeowners.
Texas Department of Insurance, PDF page 15 (page footer reads 13), 'Fiscal year activities' table (show the source wording)
The source says“Insurance complaints resolved (1.1.1 OP 1) 18,576 19,607”
Read it at the source (opens in a new tab)
Louisiana
See also Louisiana storm and disaster data.
-
460,709
Insurance claims reported from Hurricane Ida in Louisiana, all lines (residential property: 359,548). · As of June 30, 2022
Read with care: Insurer-reported data call. Private flood only; excludes the National Flood Insurance Program. A later final compilation may exist on the department's data call results page, which could not be opened by automated fetch.
Louisiana Department of Insurance, Table 'Losses Reported by Line', row 'Statewide, All Lines Combined' (show the source wording)
The source says“Statewide, All Lines Combined 460,709 299,440 106,987 88% 65% 9,804,171,968”
Read it at the source (opens in a new tab) -
106,987 of 460,709
Hurricane Ida claims in Louisiana closed without payment, all lines (residential property: 90,039 of 359,548). · As of June 30, 2022
Read with care: Closed without payment includes losses below the named-storm deductible as well as denials. 12% of claims were still open at this date.
Louisiana Department of Insurance, Table 'Losses Reported by Line', rows 'Statewide, All Lines Combined' and 'Residential Property' (show the source wording)
The source says“Residential Property 359,548 226,470 90,039 88% 63% 6,217,684,225”
Read it at the source (opens in a new tab) -
$9,804,171,968 paid; $13,113,511,697 paid plus reserves
Losses paid by insurers for Hurricane Ida in Louisiana, and paid losses plus reserves on reported claims, all lines. · As of June 30, 2022
Read with care: Ten months after landfall; later payments are not included. Excludes the National Flood Insurance Program.
Louisiana Department of Insurance, Table 'Losses Reported by Line', row 'Statewide, All Lines Combined' (show the source wording)
The source says“Statewide, All Lines Combined 460,709 299,440 106,987 88% 65% 9,804,171,968”
Read it at the source (opens in a new tab) -
33.76%
Share of homeowners claims closed during the year that were closed without any payment. Statewide industry ratio for LA. · Data year 2025
Read with care: Ratios are built from insurer filings to state regulators. The Florida figure does not include Citizens Property Insurance Corporation. The workbook has no national average row. Not every insurer files: small writers are exempt. Closed without payment includes losses below the deductible. The quote is the ratio's definition in the workbook; the number is the cell value for the state.
National Association of Insurance Commissioners (NAIC), Sheet 'HO', block 'Ratio 1', row LA, column 'State Ratio' (show the source wording)
The source says“Ratio 1: Claims closed without payment to the total claims closed.”
Read it at the source (opens in a new tab) -
22.09%
Share of paid homeowners claims that were paid more than 60 days after the claim was reported. Statewide industry ratio for LA. · Data year 2025
Read with care: Ratios are built from insurer filings to state regulators. The Florida figure does not include Citizens Property Insurance Corporation. The workbook has no national average row. Not every insurer files: small writers are exempt. The quote is the ratio's definition in the workbook; the number is the cell value for the state.
National Association of Insurance Commissioners (NAIC), Sheet 'HO', block 'Ratio 3', row LA, column 'State Ratio' (show the source wording)
The source says“Ratio 3: Percentage of claims paid beyond 60 days.”
Read it at the source (opens in a new tab) -
3.05%
Lawsuits opened against homeowners insurers during the year, as a proportion of claims closed without payment. A rough gauge of how litigated a state's homeowners claims are. Statewide industry ratio for LA. · Data year 2025
Read with care: Ratios are built from insurer filings to state regulators. The Florida figure does not include Citizens Property Insurance Corporation. The workbook has no national average row. Not every insurer files: small writers are exempt. The quote is the ratio's definition in the workbook; the number is the cell value for the state.
National Association of Insurance Commissioners (NAIC), Sheet 'HO', block 'Ratio 7', row LA, column 'State Ratio' (show the source wording)
The source says“Ratio 7: Suits opened during the period to claims closed without payment.”
Read it at the source (opens in a new tab) -
485,743
National Flood Insurance Program claim records for LA in FEMA's public claims dataset. · Losses 1978 to 2026; dataset as served November 10, 2026
Read with care: Counted this session through the OpenFEMA API; the quote is the API's record count for our query. One record per NFIP claim transaction in the redacted dataset, all years since 1978. Federal flood insurance only; not homeowners insurance.
Federal Emergency Management Agency (OpenFEMA), API metadata 'count' for $filter=state eq 'LA' (show the source wording)
Complaints to the regulator
-
7,682 of 21,143 (36.3%)
Complaints received by the Louisiana Department of Insurance about homeowners insurance, out of all complaints across every line. Homeowners was the largest category. · Calendar years 2017-2021
Read with care: Prepared by the legislative auditor from department data. Period includes Hurricanes Laura (2020) and Ida (2021).
Louisiana Legislative Auditor, Page 2, Exhibit 1 (show the source wording)
-
441 (2019), 1,356 (2020), 5,264 (2021)
Residential property insurance complaints received by the Louisiana Department of Insurance each year, before and after Hurricanes Laura and Ida. · Calendar years 2019-2021
Read with care: The yearly counts are labels on a bar chart (Exhibit 2); the quoted text gives the percentage changes, which match those counts.
Louisiana Legislative Auditor, Page 3, text and Exhibit 2 (show the source wording)
The source says“complaints tripled (207.5% increase) from calendar year 2019 to calendar year 2020 and increased even further (288.2% increase) from calendar year 2020 to calendar year 2021.”
Read it at the source (opens in a new tab) -
1.2% (4,025 complaints on 339,193 claims)
Share of Hurricane Ida residential property claims in Louisiana that led to a complaint to the insurance department (Hurricane Laura: 1.0%, 1,392 complaints on 133,415 claims). · Hurricane Ida (2021), complaints through early 2022
Read with care: Claim counts were unaudited figures from the department's website at the time. Most people with a problem never file a regulator complaint, so this understates dissatisfaction.
Louisiana Legislative Auditor, Pages 3-4, text and Exhibit 3 (show the source wording)
The source says“For Hurricane Ida, there were 339,193 residential property claims and 4,025 complaints made, which represented 1.2% of total claims.”
Read it at the source (opens in a new tab) -
3,004 (53.4%)
Hurricane-related residential property complaints in Louisiana that cited claim delay, the most common claims-handling issue (unsatisfactory offer 1,614; denial 996; adjuster handling 975). · Complaints about the 2020 and 2021 hurricanes
Read with care: A complaint can list more than one issue, so percentages add to more than 100. Base is 5,629 claims-handling complaints.
Louisiana Legislative Auditor, Page 4, Exhibit 4 (show the source wording)
-
5,629 of 5,883 (95.7%)
Share of hurricane-related residential property complaints in Louisiana that were about how the insurer handled the claim. · Complaints about the 2020 and 2021 hurricanes
Read with care: 96.8% of these complaints named the insurance company; 1.5% (87) named an insurance adjuster. The brief does not separate public adjusters.
Louisiana Legislative Auditor, Page 4 (show the source wording)
The source says“5,629 (95.7%) were associated with policyholders' dissatisfaction with the way their insurers handled or were handling their claims.”
Read it at the source (opens in a new tab) -
3,960 total; 2,374 property and casualty
Complaints received by the Louisiana Department of Insurance in the fiscal year, in total and for property and casualty insurance. · Fiscal year 2024-2025
Read with care: Property and casualty includes auto. The report does not break out homeowners in this table.
Louisiana Department of Insurance, Page 69, Table 31 (show the source wording)
The source says“Complaints Received 411 1,175 2,374 3,960”
Read it at the source (opens in a new tab)
North Carolina
See also North Carolina storm and disaster data.
-
125,658
Insurance claims reported from Hurricane Helene in North Carolina, all lines (residential property: 93,060). · Claims as of September 12, 2025
Read with care: Insurer-reported data call. Private insurance only; most Helene flood damage in western North Carolina was not covered by these policies.
North Carolina Department of Insurance, Statewide Summary table, Totals row (show the source wording)
The source says“Totals 11,461,137 125,658 2,920 1,544 88,222 32,808 96.3% $3,487,391,280 $2,213,094,316”
Read it at the source (opens in a new tab) -
32,808 of 125,658
Hurricane Helene claims in North Carolina closed without payment, all lines (residential property: 25,533 of 93,060). · Claims as of September 12, 2025
Read with care: Closed without payment includes flood damage not covered by a homeowners policy and losses below the deductible, as well as denials.
North Carolina Department of Insurance, Statewide Summary table, Totals and Residential Property rows (show the source wording)
The source says“Residential Property 4,092,946 93,060 1,925 516 64,988 25,533 97.3%”
Read it at the source (opens in a new tab) -
$2,213,094,316 paid; $3,487,391,280 incurred
Losses paid and total incurred losses reported by insurers for Hurricane Helene in North Carolina, all lines. · Claims as of September 12, 2025
Read with care: Paid loss includes adjustment expense paid; incurred adds reserves. Private insurance only.
North Carolina Department of Insurance, Statewide Summary table, Totals row (show the source wording)
The source says“Totals 11,461,137 125,658 2,920 1,544 88,222 32,808 96.3% $3,487,391,280 $2,213,094,316”
Read it at the source (opens in a new tab) -
30.03%
Share of homeowners claims closed during the year that were closed without any payment. Statewide industry ratio for NC. · Data year 2025
Read with care: Ratios are built from insurer filings to state regulators. The Florida figure does not include Citizens Property Insurance Corporation. The workbook has no national average row. Not every insurer files: small writers are exempt. Closed without payment includes losses below the deductible. The quote is the ratio's definition in the workbook; the number is the cell value for the state.
National Association of Insurance Commissioners (NAIC), Sheet 'HO', block 'Ratio 1', row NC, column 'State Ratio' (show the source wording)
The source says“Ratio 1: Claims closed without payment to the total claims closed.”
Read it at the source (opens in a new tab) -
25.54%
Share of paid homeowners claims that were paid more than 60 days after the claim was reported. Statewide industry ratio for NC. · Data year 2025
Read with care: Ratios are built from insurer filings to state regulators. The Florida figure does not include Citizens Property Insurance Corporation. The workbook has no national average row. Not every insurer files: small writers are exempt. The quote is the ratio's definition in the workbook; the number is the cell value for the state.
National Association of Insurance Commissioners (NAIC), Sheet 'HO', block 'Ratio 3', row NC, column 'State Ratio' (show the source wording)
The source says“Ratio 3: Percentage of claims paid beyond 60 days.”
Read it at the source (opens in a new tab) -
0.69%
Lawsuits opened against homeowners insurers during the year, as a proportion of claims closed without payment. A rough gauge of how litigated a state's homeowners claims are. Statewide industry ratio for NC. · Data year 2025
Read with care: Ratios are built from insurer filings to state regulators. The Florida figure does not include Citizens Property Insurance Corporation. The workbook has no national average row. Not every insurer files: small writers are exempt. The quote is the ratio's definition in the workbook; the number is the cell value for the state.
National Association of Insurance Commissioners (NAIC), Sheet 'HO', block 'Ratio 7', row NC, column 'State Ratio' (show the source wording)
The source says“Ratio 7: Suits opened during the period to claims closed without payment.”
Read it at the source (opens in a new tab) -
109,593
National Flood Insurance Program claim records for NC in FEMA's public claims dataset. · Losses 1978 to 2026; dataset as served November 10, 2026
Read with care: Counted this session through the OpenFEMA API; the quote is the API's record count for our query. One record per NFIP claim transaction in the redacted dataset, all years since 1978. Federal flood insurance only; not homeowners insurance.
Federal Emergency Management Agency (OpenFEMA), API metadata 'count' for $filter=state eq 'NC' (show the source wording)
California
See also California storm and disaster data.
-
41,727
Residential and commercial property claims filed for the January 2025 Palisades and Eaton fires in Los Angeles County (40,482 partially paid). · Page updated July 6, 2026
Read with care: From insurers including the FAIR Plan and surplus lines writers 'representing most' of the market, not all of it. Excludes 7,133 auto claims shown in the linked PDF. 'Partially paid' means at least one payment made.
California Department of Insurance, Headline figures at top of page (show the source wording)
-
$25.2 Billion
Amount insurers have paid on property claims from the January 2025 Palisades and Eaton fires. · Page updated July 6, 2026
Read with care: Includes advance payments required by California law and debris removal. Payments will keep growing as rebuilding continues.
California Department of Insurance, Headline figures at top of page (show the source wording)
-
38,737 claims; $23,409,782,495 paid
Residential personal property claims from the Palisades and Eaton fires and the amount paid to date (Palisades 15,890 claims; Eaton 22,847 claims). · As of July 2026
Read with care: 37,957 of the 38,737 claims had received a payment. The column headings in the PDF are laid out above the table, so check the PDF itself when citing commercial and auto columns.
California Department of Insurance, Table, TOTAL row, residential columns (show the source wording)
-
34.04%
Share of homeowners claims closed during the year that were closed without any payment. Statewide industry ratio for CA. · Data year 2025
Read with care: Ratios are built from insurer filings to state regulators. The Florida figure does not include Citizens Property Insurance Corporation. The workbook has no national average row. Not every insurer files: small writers are exempt. Closed without payment includes losses below the deductible. The quote is the ratio's definition in the workbook; the number is the cell value for the state.
National Association of Insurance Commissioners (NAIC), Sheet 'HO', block 'Ratio 1', row CA, column 'State Ratio' (show the source wording)
The source says“Ratio 1: Claims closed without payment to the total claims closed.”
Read it at the source (opens in a new tab) -
33.96%
Share of paid homeowners claims that were paid more than 60 days after the claim was reported. Statewide industry ratio for CA. · Data year 2025
Read with care: Ratios are built from insurer filings to state regulators. The Florida figure does not include Citizens Property Insurance Corporation. The workbook has no national average row. Not every insurer files: small writers are exempt. The quote is the ratio's definition in the workbook; the number is the cell value for the state.
National Association of Insurance Commissioners (NAIC), Sheet 'HO', block 'Ratio 3', row CA, column 'State Ratio' (show the source wording)
The source says“Ratio 3: Percentage of claims paid beyond 60 days.”
Read it at the source (opens in a new tab) -
2.23%
Lawsuits opened against homeowners insurers during the year, as a proportion of claims closed without payment. A rough gauge of how litigated a state's homeowners claims are. Statewide industry ratio for CA. · Data year 2025
Read with care: Ratios are built from insurer filings to state regulators. The Florida figure does not include Citizens Property Insurance Corporation. The workbook has no national average row. Not every insurer files: small writers are exempt. The quote is the ratio's definition in the workbook; the number is the cell value for the state.
National Association of Insurance Commissioners (NAIC), Sheet 'HO', block 'Ratio 7', row CA, column 'State Ratio' (show the source wording)
The source says“Ratio 7: Suits opened during the period to claims closed without payment.”
Read it at the source (opens in a new tab) -
53,563
National Flood Insurance Program claim records for CA in FEMA's public claims dataset. · Losses 1978 to 2026; dataset as served November 10, 2026
Read with care: Counted this session through the OpenFEMA API; the quote is the API's record count for our query. One record per NFIP claim transaction in the redacted dataset, all years since 1978. Federal flood insurance only; not homeowners insurance.
Federal Emergency Management Agency (OpenFEMA), API metadata 'count' for $filter=state eq 'CA' (show the source wording)
Complaints to the regulator
-
5,592
Complaints about homeowners insurance counted by the California Department of Insurance in its 2025 review of complaints by line of business. Homeowners ranked second after private passenger auto (16,370). · Calendar year 2025
Read with care: From the department's market analysis of complaints against insurers; dwelling fire is listed separately (928). Counts complaints, not confirmed violations.
California Department of Insurance, Page 99 (PDF page 111), table of five lines with most complaints (show the source wording)
-
17.25%
Homeowners share of consumer complaints handled by the California Department of Insurance (12.98% in 2022; 16.36% in 2023; 17.57% in 2024; 17.25% in 2025). · Calendar years 2022-2025
Read with care: Share of complaints, not a count. 'Fire, Allied Lines & CMP' is a separate line (5.05% in 2025).
California Department of Insurance, Page 90 (PDF page 102), table 'Percentage of Complaints by Lines of Coverage' (show the source wording)
-
64,848 opened; 62,286 closed
Consumer complaint cases opened and closed by the California Department of Insurance across all lines of insurance. · Calendar year 2025
Read with care: All lines of insurance, not only homeowners.
California Department of Insurance, Page 88 (PDF page 100), table 'CSMCB Results for Calendar Year 2025' (show the source wording)
Connecticut
See also Connecticut storm and disaster data.
Complaints to the regulator
-
1,931 (1,392 about claim handling)
Complaints opened by the Connecticut Insurance Department in 2025 with coverage 'Homeowners', and how many listed claim handling as the reason (1,716 in 2024; 1,144 in 2023). · Calendar year 2025
Read with care: Counted this session through the portal's API; the quote is the API's answer to our query. One row per complaint against a company; condominium and commercial property are separate coverage values.
Connecticut Insurance Department (Connecticut Open Data), API queries: count where coverage = 'Homeowners' grouped by year of 'opened'; and grouped by reason for 2025 (show the source wording)
United States
-
2,725,989
National Flood Insurance Program claim records nationwide in FEMA's public claims dataset. · Losses 1978 to 2026; dataset as served November 10, 2026
Read with care: Counted this session through the OpenFEMA API; the quote is the API's record count for our query. One record per NFIP claim transaction in the redacted dataset, all years since 1978. Federal flood insurance only; not homeowners insurance.
Federal Emergency Management Agency (OpenFEMA), API metadata 'count' for the whole dataset (show the source wording)
Common questions
Which recent storm produced the most insurance claims?
How many storm claims close without payment?
Use these figures
Each statistic opens to show the words it came from and a link to the original document. Please cite the original publisher for the number, and link this page if it helped you find it.
Public adjuster statisticsYour insurer's deadlinesAll state data