Storm damage and disaster data by state
What hits each state, how often, and how much damage is reported. Compiled from federal records, with a page for every state and rankings you can cite.
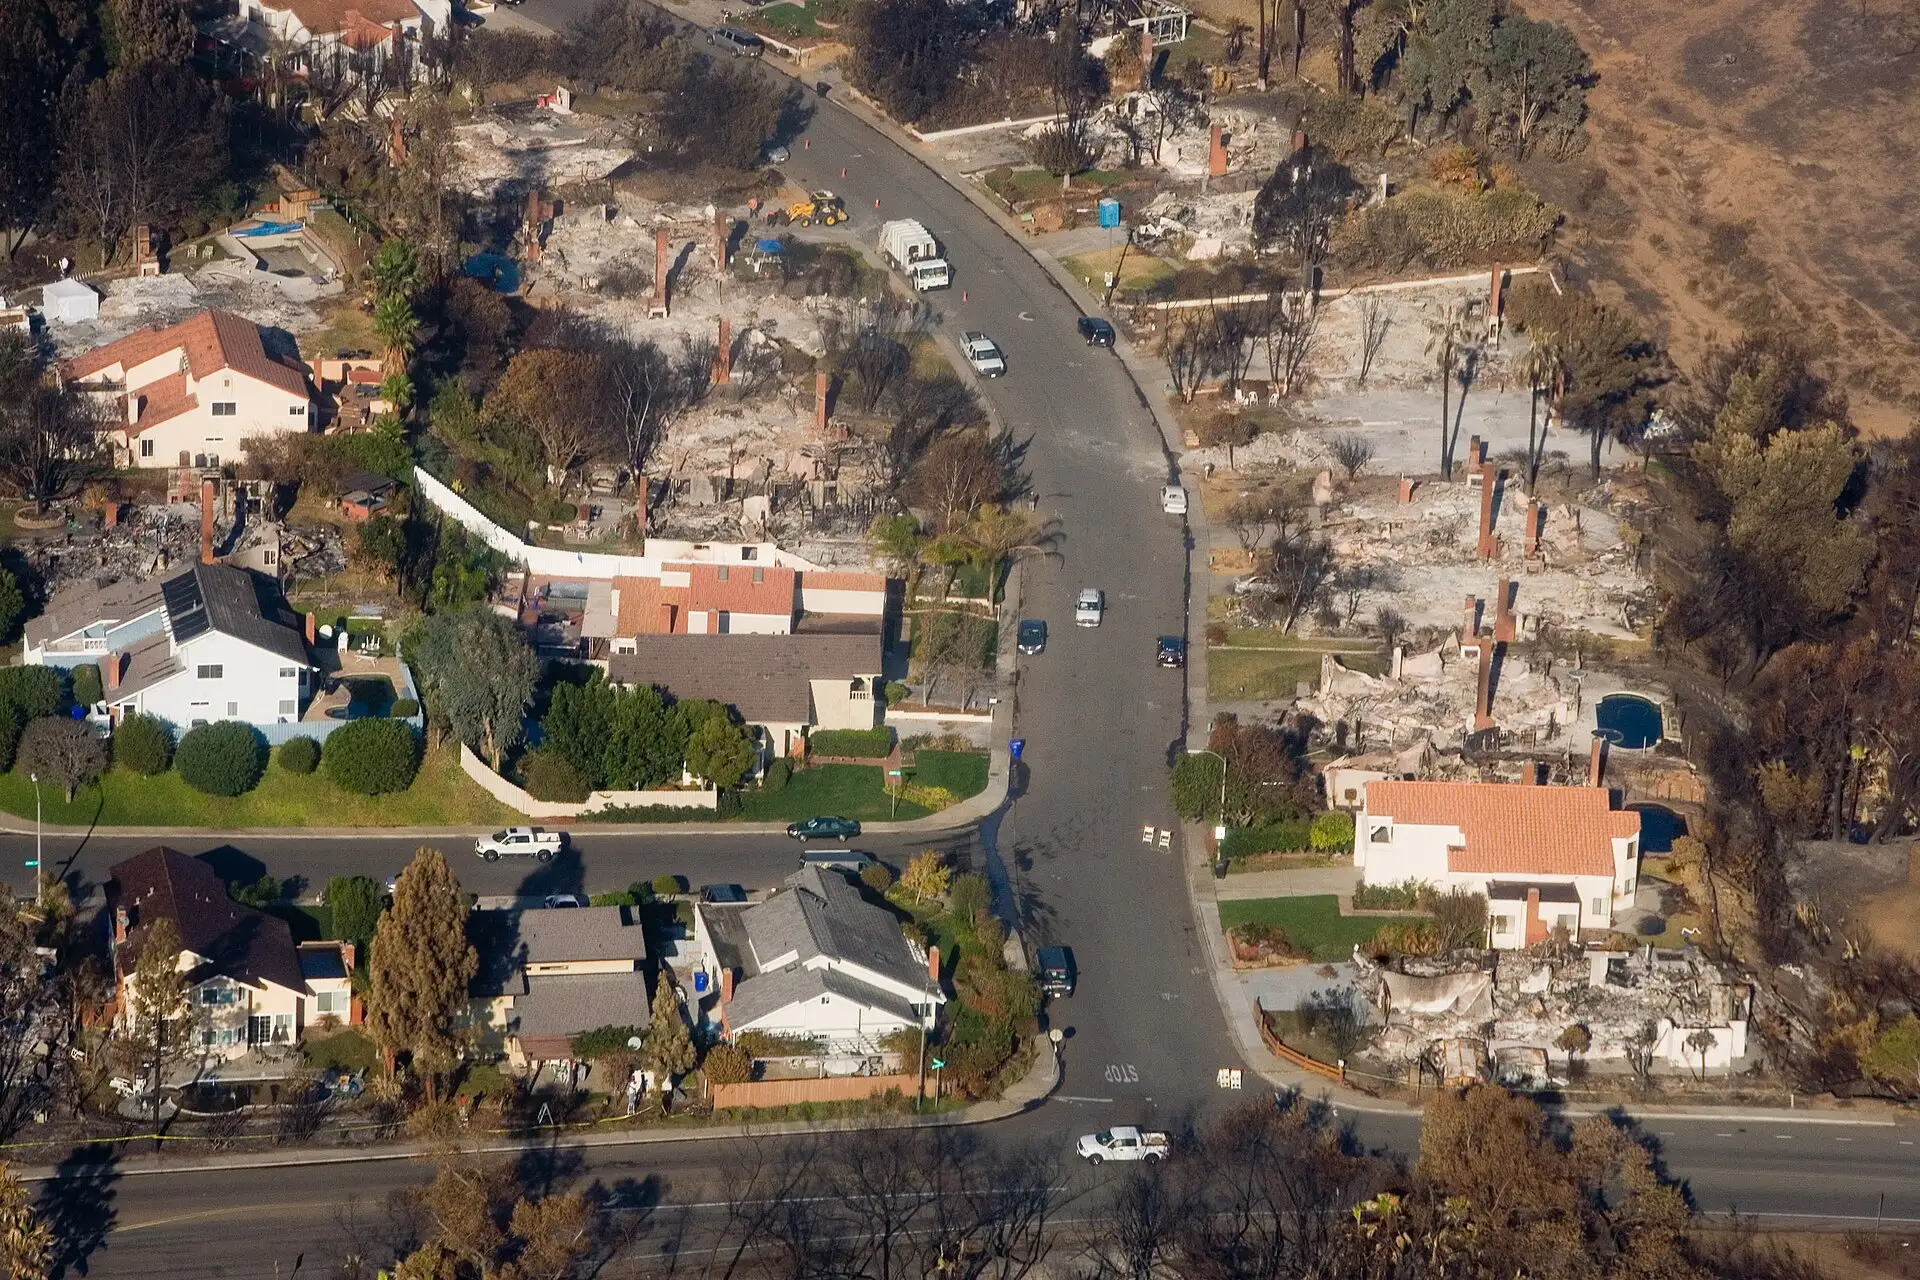
Photo: homes destroyed by wildfire in Rancho Bernardo, California, October 2007. Andrea Booher / FEMA, public domain. Use does not imply endorsement.

storm event reports in the 50 states and D.C., 2016–2025
property damage estimated in those reports
major disaster declarations since 2000
homeowners who registered with FEMA since 2002
home damage verified by FEMA inspectors since 2002
state data pages, each with rankings and charts
Official claim figures
Public adjuster statistics
How often public adjusters are involved, what happened to payments and timelines, licence counts and complaints. From regulators and a state legislature, with every source.
See what official data showsClaim statistics after major storms
Claims filed, amounts paid and claims closed without payment after Ian, Irma, Harvey, Uri, Ida, Helene and the Los Angeles fires.
See the figuresRankings
Storm damage by state
First: Texas, $67 billion
See all states rankedHail reports by state
First: Texas, 12,919
See all states rankedTornadoes by state
First: Texas, 1,244
See all states rankedFlood reports by state
First: Texas, 4,478
See all states rankedDisaster declarations by state
First: Oklahoma, 62
See all states rankedFEMA-verified home damage by state
First: Louisiana, $7.6 billion
See all states rankedEvery state, side by side
Select a column heading to sort. Select a state for its full page.
| Alabama | 13,691 | $481M | 117 | 861 | 41 | $811M |
|---|---|---|---|---|---|---|
| Alaska | 2,463 | $120M | 0 | 1 | 47 | $144M |
| Arizona | 9,023 | $351M | 9 | 58 | 23 | $5.4M |
| Arkansas | 12,394 | $861M | 208 | 445 | 41 | $173M |
| California | 22,551 | $22B | 3 | 63 | 53 | $2.9B |
| Colorado | 17,048 | $5.5B | 583 | 414 | 13 | $85.3M |
| Connecticut | 2,452 | $79.7M | 2 | 31 | 15 | $78.6M |
| Delaware | 1,309 | $3.8M | 2 | 17 | 12 | $2.6M |
| District of Columbia | 431 | $29.2M | 0 | 4 | 12 | $703K |
| Florida | 11,638 | $42B | 42 | 558 | 44 | $6.8B |
| Georgia | 15,321 | $3.8B | 38 | 612 | 25 | $384M |
| Hawaii | 5,441 | $5.7B | 0 | 0 | 24 | $278M |
| Idaho | 4,769 | $450M | 7 | 20 | 18 | $0 |
| Illinois | 20,278 | $1.5B | 196 | 875 | 24 | $945M |
| Indiana | 11,372 | $308M | 109 | 381 | 23 | $370M |
| Iowa | 19,781 | $879M | 270 | 759 | 42 | $333M |
| Kansas | 23,068 | $266M | 838 | 593 | 51 | $72.5M |
| Kentucky | 17,490 | $202M | 86 | 397 | 50 | $463M |
| Louisiana | 10,452 | $37B | 83 | 683 | 37 | $7.6B |
| Maine | 4,340 | $205M | 3 | 11 | 30 | $18.5M |
| Maryland | 9,412 | $257M | 20 | 76 | 17 | $64.3M |
| Massachusetts | 6,176 | $78.6M | 3 | 37 | 20 | $107M |
| Michigan | 8,174 | $2.1B | 63 | 147 | 14 | $605M |
| Minnesota | 17,878 | $277M | 355 | 550 | 30 | $49.0M |
| Mississippi | 13,237 | $987M | 94 | 1,039 | 47 | $2.7B |
| Missouri | 20,475 | $2.6B | 343 | 596 | 49 | $334M |
| Montana | 12,789 | $89.3M | 186 | 38 | 31 | $29.2M |
| Nebraska | 18,639 | $1.2B | 679 | 484 | 46 | $56.2M |
| Nevada | 4,280 | $189M | 1 | 10 | 9 | $1.9M |
| New Hampshire | 2,360 | $90.9M | 2 | 13 | 34 | $20.2M |
| New Jersey | 7,357 | $239M | 6 | 55 | 25 | $1.3B |
| New Mexico | 10,160 | $916M | 126 | 116 | 24 | $79.1M |
| New York | 20,381 | $960M | 29 | 112 | 45 | $2.0B |
| North Carolina | 14,983 | $5.9B | 63 | 330 | 29 | $781M |
| North Dakota | 10,007 | $322M | 235 | 266 | 39 | $138M |
| Ohio | 14,768 | $929M | 64 | 422 | 25 | $212M |
| Oklahoma | 21,839 | $933M | 678 | 948 | 62 | $255M |
| Oregon | 3,314 | $3.9B | 7 | 28 | 25 | $83.2M |
| Pennsylvania | 17,957 | $681M | 48 | 253 | 21 | $490M |
| Rhode Island | 815 | $6.4M | 0 | 9 | 11 | $49.2M |
| South Carolina | 9,203 | $759M | 36 | 312 | 21 | $302M |
| South Dakota | 21,079 | $255M | 413 | 201 | 45 | $37.0M |
| Tennessee | 15,464 | $2.6B | 81 | 395 | 49 | $443M |
| Texas | 48,031 | $67B | 1,986 | 1,244 | 40 | $4.8B |
| Utah | 4,253 | $237M | 1 | 19 | 12 | $838K |
| Vermont | 3,215 | $224M | 0 | 5 | 38 | $61.4M |
| Virginia | 21,898 | $641M | 55 | 175 | 32 | $154M |
| Washington | 3,870 | $3.3B | 2 | 22 | 33 | $115M |
| West Virginia | 11,131 | $279M | 35 | 42 | 46 | $277M |
| Wisconsin | 12,983 | $662M | 171 | 330 | 23 | $260M |
| Wyoming | 11,376 | $80.4M | 147 | 102 | 10 | $3.6M |
Storm figures cover 2016 to 2025. Major disasters are counted since 2000; FEMA-verified home damage since November 2002. Damage figures are estimates, not insured losses.
The national picture
- Texas $67B
- Florida $42B
- Louisiana $37B
- California $22B
- North Carolina $5.9B
- Hawaii $5.7B
- Colorado $5.5B
- Oregon $3.9B
- Georgia $3.8B
- Washington $3.3B
- Damaging wind 230,763
- Winter weather 113,976
- Hail 87,665
- Flood 69,884
- Tornado 15,159
- Hurricane and tropical storm 4,122
- Wildfire 3,484
- Lightning 2,960
- Hurricane and tropical storm $81B
- Flood $74B
- Wildfire $30B
- Tornado $13B
- Hail $11B
- Damaging wind $8.6B
- Winter weather $1.3B
- Lightning $210M
How the figures are built, and their limits
Storm reports and reported damage
From the NOAA Storm Events Database, covering 2016 to 2025. We read NOAA's yearly bulk files and add up the records for each state. Marine zones and territories are left out.
- A report is not a storm. The National Weather Service records one entry per event per county or forecast zone, so one storm system can produce many reports.
- Damage figures are estimates. They come from emergency managers, utilities, news reports and other outside sources. The Service's own instruction says it "does not guarantee the accuracy or validity of the information" (NWS Instruction 10-1605).
- Many reports have no damage estimate. A blank is not a zero, so totals understate damage.
- These are not insurance figures. They are not insured losses or claim payments, and they are not adjusted for inflation.
Disaster declarations
From FEMA's Web Disaster Declarations data, counting declarations dated 2000 or later. A declaration is a federal decision to provide aid. It does not measure how much damage occurred, and one storm that crosses three states counts three times.
FEMA-verified home damage
From FEMA's Housing Assistance Program Data for owners, which starts with disaster 1439 in November 2002. "Verified damage" is the loss FEMA inspectors recorded for homeowners who registered for help: home damage plus essential personal property. It covers only people who registered and were inspected, so it is far below total damage. FEMA notes the data is self-reported in part and "subject to human error".
Population
Per-resident figures use the U.S. Census Bureau's July 2024 state population estimates (Vintage 2024).
Figures compiled 2026-11-10. NOAA revises its files as late reports arrive, so totals can change slightly between updates.
Use this data
You are welcome to quote these figures and reuse the charts in news stories, research and blog posts. Please credit the page with a link.
PublicAdjuster.cc, "Storm damage and disaster data by state," https://publicadjuster.cc/data/. Compiled from the NOAA Storm Events Database and FEMA OpenFEMA data, November 10, 2026.
Download all states (CSV) How the figures are built
The underlying records are published by NOAA, FEMA and the U.S. Census Bureau. This product uses the FEMA OpenFEMA API, but is not endorsed by FEMA. The Federal Government or FEMA cannot vouch for the data or analyses derived from these data after the data have been retrieved from the Agency's website(s).