Federal disaster declarations by state since 2000
Major disaster and emergency declarations in each state since 2000, from FEMA, with the most common cause.
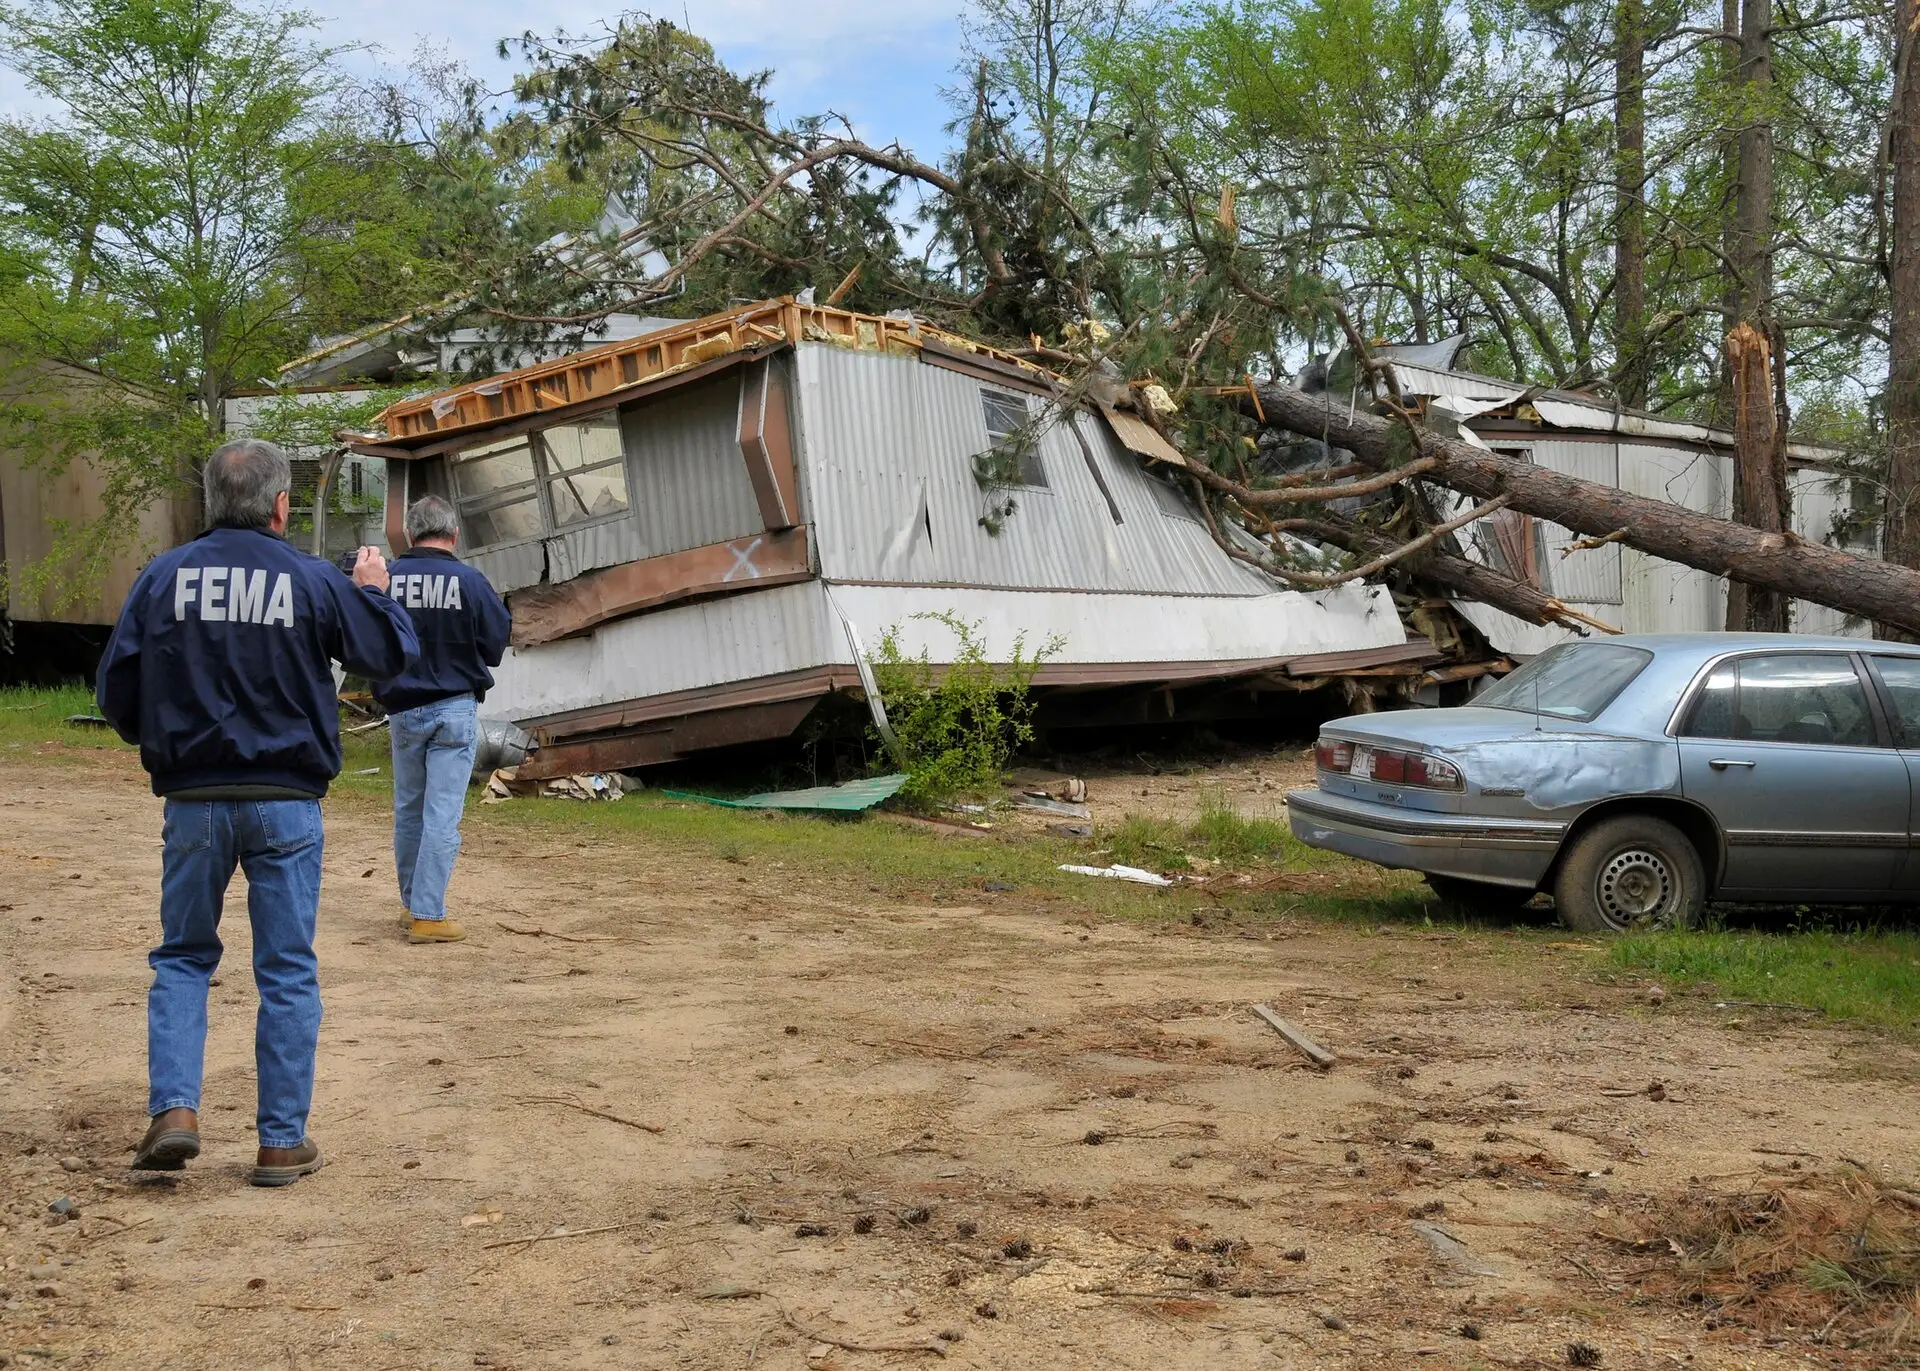
Photo: federal damage assessors in De Queen, Arkansas, after a tornado, April 2009. Win Henderson / FEMA, public domain. Use does not imply endorsement.

Oklahoma ranks first with 62, followed by California (53) and Kansas (51).
The top five states account for 17% of the national total.
The top ten
- Oklahoma 62
- California 53
- Kansas 51
- Kentucky 50
- Missouri 49
- Tennessee 49
- Alaska 47
- Mississippi 47
- Nebraska 46
- West Virginia 46
All states, ranked
| Rank | State | Major disaster declarations | Emergencies | Most common cause | Latest |
|---|---|---|---|---|---|
| 1 | Oklahoma | 62 | 25 | Severe Storm | 2026 |
| 2 | California | 53 | 13 | Severe Storm | 2025 |
| 3 | Kansas | 51 | 8 | Severe Storm | 2026 |
| 4 | Kentucky | 50 | 7 | Severe Storm | 2026 |
| 5 | Missouri | 49 | 8 | Severe Storm | 2026 |
| 6 | Tennessee | 49 | 8 | Severe Storm | 2026 |
| 7 | Alaska | 47 | 2 | Severe Storm | 2026 |
| 8 | Mississippi | 47 | 13 | Severe Storm | 2026 |
| 9 | Nebraska | 46 | 7 | Severe Storm | 2026 |
| 10 | West Virginia | 46 | 6 | Severe Storm | 2026 |
| 11 | New York | 45 | 22 | Severe Storm | 2024 |
| 12 | South Dakota | 45 | 5 | Severe Storm | 2026 |
| 13 | Florida | 44 | 28 | Hurricane | 2026 |
| 14 | Iowa | 42 | 4 | Severe Storm | 2026 |
| 15 | Alabama | 41 | 12 | Severe Storm | 2023 |
| 16 | Arkansas | 41 | 8 | Severe Storm | 2025 |
| 17 | Texas | 40 | 15 | Flood | 2026 |
| 18 | North Dakota | 39 | 7 | Severe Storm | 2026 |
| 19 | Vermont | 38 | 6 | Severe Storm | 2024 |
| 20 | Louisiana | 37 | 25 | Hurricane | 2026 |
| 21 | New Hampshire | 34 | 12 | Severe Storm | 2026 |
| 22 | Washington | 33 | 8 | Severe Storm | 2026 |
| 23 | Virginia | 32 | 8 | Severe Storm | 2025 |
| 24 | Montana | 31 | 4 | Severe Storm | 2026 |
| 25 | Maine | 30 | 14 | Severe Storm | 2024 |
| 26 | Minnesota | 30 | 7 | Severe Storm | 2025 |
| 27 | North Carolina | 29 | 13 | Hurricane | 2025 |
| 28 | Georgia | 25 | 11 | Severe Storm | 2024 |
| 29 | New Jersey | 25 | 9 | Severe Storm | 2023 |
| 30 | Ohio | 25 | 6 | Severe Storm | 2026 |
| 31 | Oregon | 25 | 3 | Severe Storm | 2026 |
| 32 | Hawaii | 24 | 6 | Severe Storm | 2026 |
| 33 | Illinois | 24 | 7 | Severe Storm | 2024 |
| 34 | New Mexico | 24 | 16 | Severe Storm | 2026 |
| 35 | Arizona | 23 | 3 | Severe Storm | 2026 |
| 36 | Indiana | 23 | 7 | Severe Storm | 2026 |
| 37 | Wisconsin | 23 | 4 | Severe Storm | 2026 |
| 38 | Pennsylvania | 21 | 7 | Severe Storm | 2024 |
| 39 | South Carolina | 21 | 13 | Hurricane | 2026 |
| 40 | Massachusetts | 20 | 18 | Severe Storm | 2026 |
| 41 | Idaho | 18 | 2 | Flood | 2026 |
| 42 | Maryland | 17 | 6 | Severe Storm | 2021 |
| 43 | Connecticut | 15 | 14 | Severe Storm | 2024 |
| 44 | Michigan | 14 | 6 | Flood | 2026 |
| 45 | Colorado | 13 | 6 | Fire | 2026 |
| 46 | Delaware | 12 | 5 | Hurricane | 2026 |
| 47 | District of Columbia | 12 | 8 | Severe Storm | 2020 |
| 48 | Utah | 12 | 2 | Flood | 2026 |
| 49 | Rhode Island | 11 | 9 | Severe Storm | 2024 |
| 50 | Wyoming | 10 | 1 | Flood | 2024 |
| 51 | Nevada | 9 | 5 | Severe Storm | 2023 |
What this measures
Presidential major disaster declarations recorded by FEMA, one per state per disaster.
- A declaration is a federal decision that a disaster exceeds state capacity. It is not a measure of how much damage occurred.
- A hurricane that crosses three states is three declarations.
More rankings
Use this data
You are welcome to quote these figures and reuse the charts in news stories, research and blog posts. Please credit the page with a link.
PublicAdjuster.cc, "Federal disaster declarations by state since 2000," https://publicadjuster.cc/data/disaster-declarations-by-state/. Compiled from the NOAA Storm Events Database and FEMA OpenFEMA data, November 10, 2026.
Download all states (CSV) How the figures are built
The underlying records are published by NOAA, FEMA and the U.S. Census Bureau. This product uses the FEMA OpenFEMA API, but is not endorsed by FEMA. The Federal Government or FEMA cannot vouch for the data or analyses derived from these data after the data have been retrieved from the Agency's website(s).