Storm damage by state, 2016–2025
Property damage reported to the National Weather Service in each state, 2016 to 2025, ranked, with damage per resident.
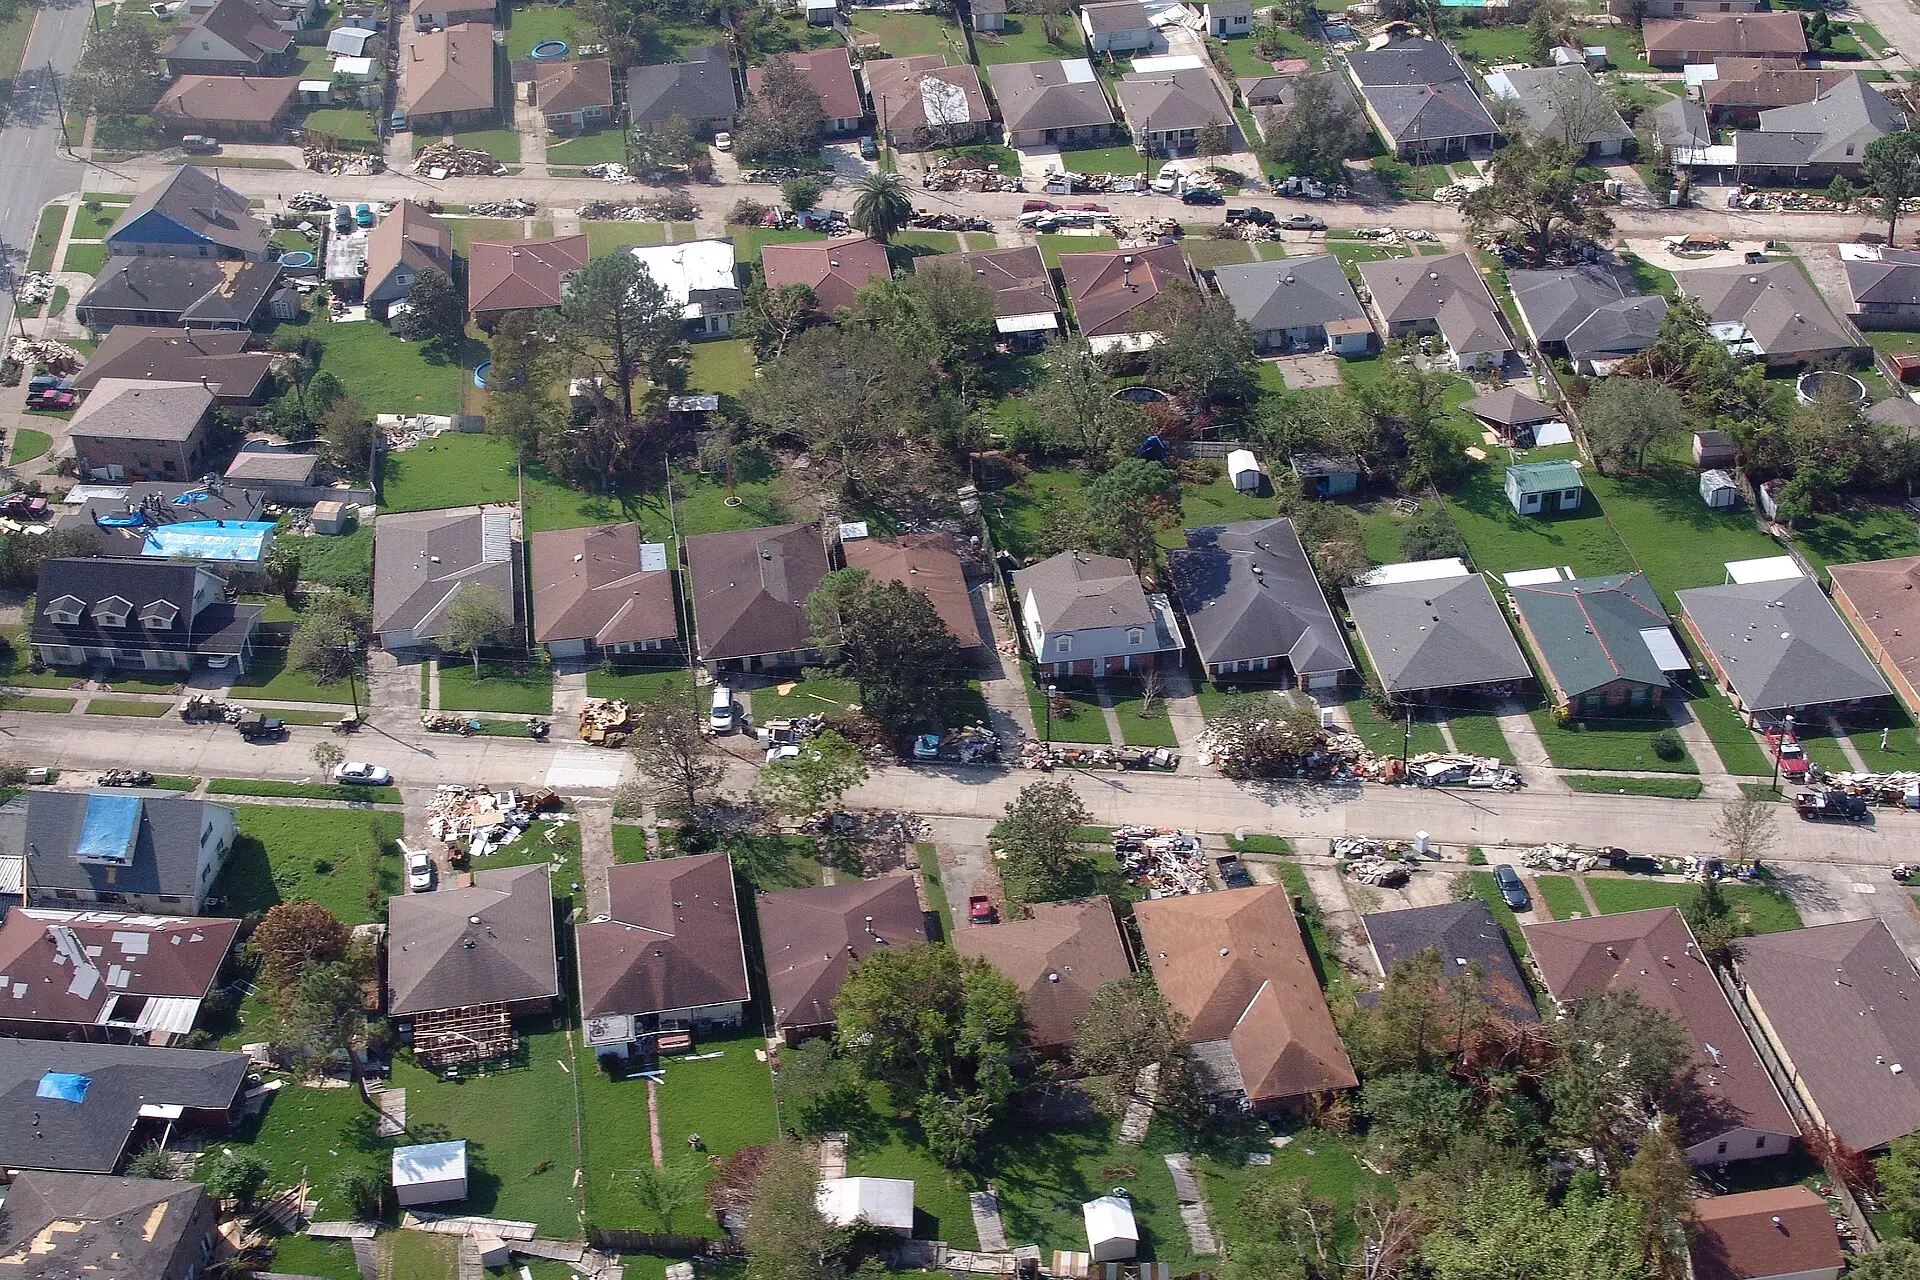
Photo: tarped roofs in Louisiana after Hurricane Katrina, September 2005. Greg Henshall / FEMA, public domain. Use does not imply endorsement.

Texas ranks first with $67 billion, followed by Florida ($42 billion) and Louisiana ($37 billion).
The top five states account for 79% of the national total.
The top ten
- Texas $67 billion
- Florida $42 billion
- Louisiana $37 billion
- California $22 billion
- North Carolina $5.9 billion
- Hawaii $5.7 billion
- Colorado $5.5 billion
- Oregon $3.9 billion
- Georgia $3.8 billion
- Washington $3.3 billion
All states, ranked
| Rank | State | Reported property damage | Per resident | Storm reports | Costliest peril |
|---|---|---|---|---|---|
| 1 | Texas | $67 billion | $2,152 | 48,031 | Flood |
| 2 | Florida | $42 billion | $1,785 | 11,638 | Hurricane and tropical storm |
| 3 | Louisiana | $37 billion | $8,127 | 10,452 | Hurricane and tropical storm |
| 4 | California | $22 billion | $558 | 22,551 | Wildfire |
| 5 | North Carolina | $5.9 billion | $533 | 14,983 | Flood |
| 6 | Hawaii | $5.7 billion | $3,936 | 5,441 | Wildfire |
| 7 | Colorado | $5.5 billion | $925 | 17,048 | Hail |
| 8 | Oregon | $3.9 billion | $919 | 3,314 | Damaging wind |
| 9 | Georgia | $3.8 billion | $337 | 15,321 | Hurricane and tropical storm |
| 10 | Washington | $3.3 billion | $415 | 3,870 | Wildfire |
| 11 | Tennessee | $2.6 billion | $355 | 15,464 | Tornado |
| 12 | Missouri | $2.6 billion | $409 | 20,475 | Tornado |
| 13 | Michigan | $2.1 billion | $209 | 8,174 | Flood |
| 14 | Illinois | $1.5 billion | $118 | 20,278 | Flood |
| 15 | Nebraska | $1.2 billion | $590 | 18,639 | Flood |
| 16 | Mississippi | $987 million | $335 | 13,237 | Tornado |
| 17 | New York | $960 million | $48 | 20,381 | Flood |
| 18 | Oklahoma | $933 million | $228 | 21,839 | Tornado |
| 19 | Ohio | $929 million | $78 | 14,768 | Tornado |
| 20 | New Mexico | $916 million | $430 | 10,160 | Flood |
| 21 | Iowa | $879 million | $271 | 19,781 | Tornado |
| 22 | Arkansas | $861 million | $279 | 12,394 | Tornado |
| 23 | South Carolina | $759 million | $139 | 9,203 | Hurricane and tropical storm |
| 24 | Pennsylvania | $681 million | $52 | 17,957 | Flood |
| 25 | Wisconsin | $662 million | $111 | 12,983 | Flood |
| 26 | Virginia | $641 million | $73 | 21,898 | Flood |
| 27 | Alabama | $481 million | $93 | 13,691 | Hurricane and tropical storm |
| 28 | Idaho | $450 million | $225 | 4,769 | Wildfire |
| 29 | Arizona | $351 million | $46 | 9,023 | Flood |
| 30 | North Dakota | $322 million | $405 | 10,007 | Hail |
| 31 | Indiana | $308 million | $45 | 11,372 | Tornado |
| 32 | West Virginia | $279 million | $158 | 11,131 | Flood |
| 33 | Minnesota | $277 million | $48 | 17,878 | Flood |
| 34 | Kansas | $266 million | $90 | 23,068 | Tornado |
| 35 | Maryland | $257 million | $41 | 9,412 | Damaging wind |
| 36 | South Dakota | $255 million | $275 | 21,079 | Flood |
| 37 | New Jersey | $239 million | $25 | 7,357 | Flood |
| 38 | Utah | $237 million | $68 | 4,253 | Flood |
| 39 | Vermont | $224 million | $346 | 3,215 | Flood |
| 40 | Maine | $205 million | $146 | 4,340 | Flood |
| 41 | Kentucky | $202 million | $44 | 17,490 | Flood |
| 42 | Nevada | $189 million | $58 | 4,280 | Flood |
| 43 | Alaska | $120 million | $163 | 2,463 | Flood |
| 44 | New Hampshire | $90.9 million | $64 | 2,360 | Flood |
| 45 | Montana | $89.3 million | $79 | 12,789 | Flood |
| 46 | Wyoming | $80.4 million | $137 | 11,376 | Wildfire |
| 47 | Connecticut | $79.7 million | $22 | 2,452 | Hurricane and tropical storm |
| 48 | Massachusetts | $78.6 million | $11 | 6,176 | Flood |
| 49 | District of Columbia | $29.2 million | $42 | 431 | Damaging wind |
| 50 | Rhode Island | $6.4 million | $6 | 815 | Hurricane and tropical storm |
| 51 | Delaware | $3.8 million | $4 | 1,309 | Flood |
What this measures
The total of the property damage estimates that the National Weather Service attached to its storm event reports.
- These are field estimates, often from emergency managers and news reports, and many storm reports carry no estimate at all.
- They are not insured losses or claim payments, and they are not adjusted for inflation.
- One very large event can dominate a state's ten-year total.
More rankings
Use this data
You are welcome to quote these figures and reuse the charts in news stories, research and blog posts. Please credit the page with a link.
PublicAdjuster.cc, "Storm damage by state, 2016–2025," https://publicadjuster.cc/data/storm-damage-by-state/. Compiled from the NOAA Storm Events Database and FEMA OpenFEMA data, November 10, 2026.
Download all states (CSV) How the figures are built
The underlying records are published by NOAA, FEMA and the U.S. Census Bureau. This product uses the FEMA OpenFEMA API, but is not endorsed by FEMA. The Federal Government or FEMA cannot vouch for the data or analyses derived from these data after the data have been retrieved from the Agency's website(s).