Flooding by state, 2016–2025
Flood and flash flood reports in each state, 2016 to 2025, with the property damage estimated in those reports.
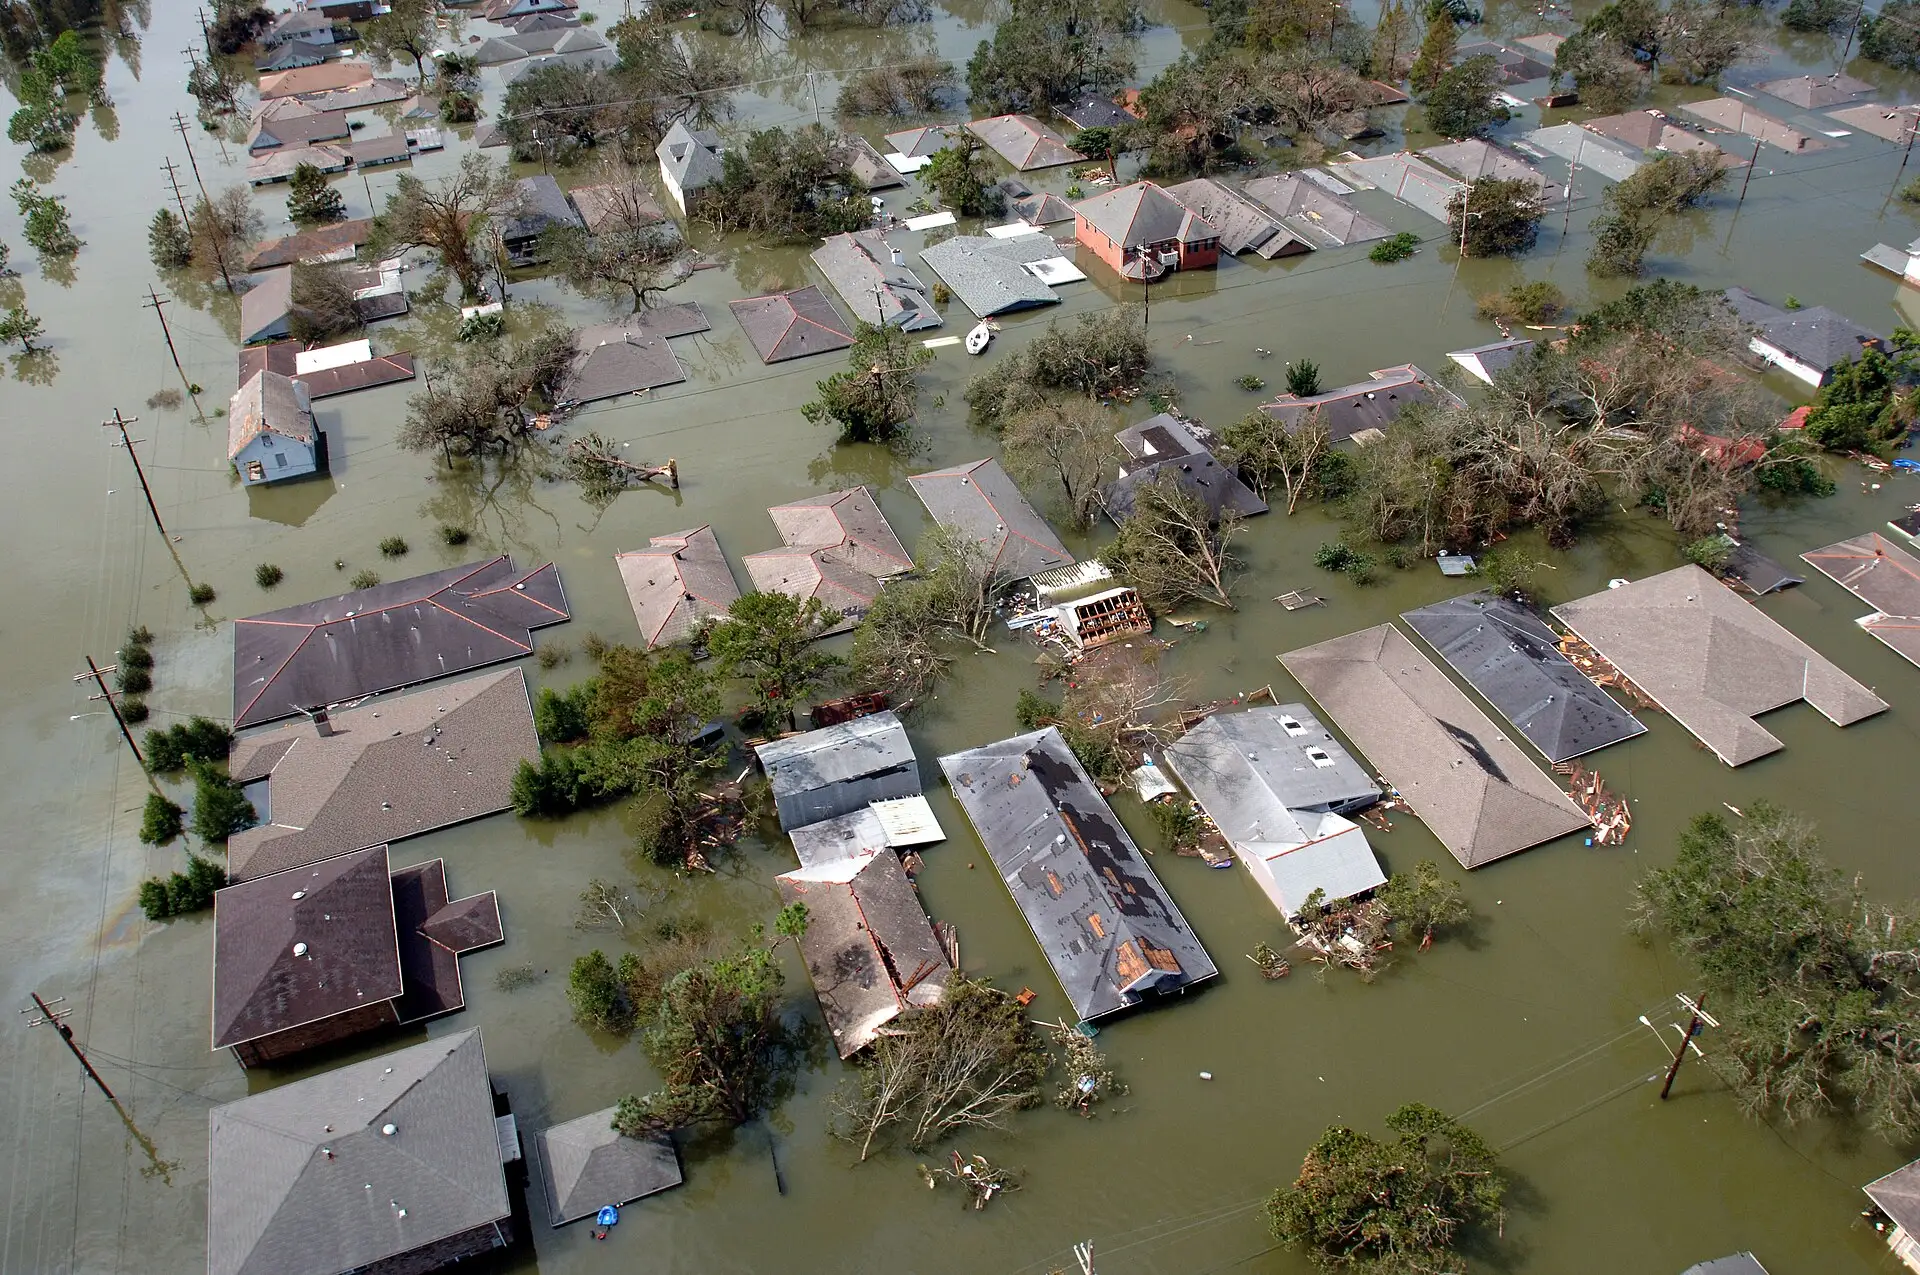
Photo: a flooded neighbourhood in New Orleans, Louisiana, August 2005. Jocelyn Augustino / FEMA, public domain. Use does not imply endorsement.

Texas ranks first with 4,478, followed by Virginia (4,330) and California (4,323).
The top five states account for 28% of the national total.
The top ten
- Texas 4,478
- Virginia 4,330
- California 4,323
- Missouri 3,441
- Kentucky 2,852
- Pennsylvania 2,737
- Ohio 2,553
- New York 2,497
- North Carolina 2,294
- Arkansas 2,267
All states, ranked
| Rank | State | Flood reports | Reported damage | Per 100,000 residents |
|---|---|---|---|---|
| 1 | Texas | 4,478 | $47 billion | 14.3 |
| 2 | Virginia | 4,330 | $315 million | 49.1 |
| 3 | California | 4,323 | $1.9 billion | 11.0 |
| 4 | Missouri | 3,441 | $394 million | 55.1 |
| 5 | Kentucky | 2,852 | $67.9 million | 62.2 |
| 6 | Pennsylvania | 2,737 | $482 million | 20.9 |
| 7 | Ohio | 2,553 | $173 million | 21.5 |
| 8 | New York | 2,497 | $755 million | 12.6 |
| 9 | North Carolina | 2,294 | $3.2 billion | 20.8 |
| 10 | Arkansas | 2,267 | $47.2 million | 73.4 |
| 11 | Arizona | 2,180 | $163 million | 28.8 |
| 12 | Illinois | 2,090 | $1.2 billion | 16.4 |
| 13 | Maryland | 2,011 | $99.3 million | 32.1 |
| 14 | West Virginia | 2,003 | $235 million | 113.2 |
| 15 | Iowa | 1,952 | $203 million | 60.2 |
| 16 | Florida | 1,729 | $2.1 billion | 7.4 |
| 17 | South Dakota | 1,723 | $207 million | 186.3 |
| 18 | Tennessee | 1,620 | $434 million | 22.4 |
| 19 | Mississippi | 1,606 | $89.8 million | 54.6 |
| 20 | Louisiana | 1,536 | $10.0 billion | 33.4 |
| 21 | New Jersey | 1,472 | $227 million | 15.5 |
| 22 | Oklahoma | 1,440 | $8.2 million | 35.2 |
| 23 | Kansas | 1,417 | $39.6 million | 47.7 |
| 24 | Georgia | 1,341 | $19.9 million | 12.0 |
| 25 | Indiana | 1,267 | $113 million | 18.3 |
| 26 | Alabama | 1,214 | $11.5 million | 23.5 |
| 27 | Wisconsin | 1,128 | $463 million | 18.9 |
| 28 | South Carolina | 1,060 | $33.3 million | 19.3 |
| 29 | Massachusetts | 927 | $36.6 million | 13.0 |
| 30 | Minnesota | 885 | $83.1 million | 15.3 |
| 31 | Nebraska | 764 | $629 million | 38.1 |
| 32 | New Mexico | 709 | $561 million | 33.3 |
| 33 | Colorado | 642 | $15.6 million | 10.8 |
| 34 | Utah | 547 | $115 million | 15.6 |
| 35 | Maine | 514 | $202 million | 36.6 |
| 36 | New Hampshire | 426 | $87.2 million | 30.2 |
| 37 | Connecticut | 419 | $10.1 million | 11.4 |
| 38 | Michigan | 414 | $923 million | 4.1 |
| 39 | Montana | 326 | $47.7 million | 28.7 |
| 40 | Nevada | 320 | $68.3 million | 9.8 |
| 41 | Washington | 293 | $395 million | 3.7 |
| 42 | Idaho | 284 | $93.7 million | 14.2 |
| 43 | Vermont | 266 | $195 million | 41.0 |
| 44 | Delaware | 245 | $3.7 million | 23.3 |
| 45 | Alaska | 235 | $82.5 million | 31.8 |
| 46 | Oregon | 234 | $59.8 million | 5.5 |
| 47 | Hawaii | 218 | $130 million | 15.1 |
| 48 | Wyoming | 212 | $32.8 million | 36.1 |
| 49 | District of Columbia | 163 | $600,000 | 23.2 |
| 50 | North Dakota | 148 | $33.6 million | 18.6 |
| 51 | Rhode Island | 132 | $1.2 million | 11.9 |
What this measures
Flash flood, flood, coastal flood and lakeshore flood events recorded by the National Weather Service.
- Standard homeowners policies generally exclude flood; flood is insured separately. These counts are storms, not claims.
- A report is one event in one county or forecast zone.
More rankings
Use this data
You are welcome to quote these figures and reuse the charts in news stories, research and blog posts. Please credit the page with a link.
PublicAdjuster.cc, "Flooding by state, 2016–2025," https://publicadjuster.cc/data/flood-reports-by-state/. Compiled from the NOAA Storm Events Database and FEMA OpenFEMA data, November 10, 2026.
Download all states (CSV) How the figures are built
The underlying records are published by NOAA, FEMA and the U.S. Census Bureau. This product uses the FEMA OpenFEMA API, but is not endorsed by FEMA. The Federal Government or FEMA cannot vouch for the data or analyses derived from these data after the data have been retrieved from the Agency's website(s).