Hail by state, 2016–2025
How many hail reports each state logged, 2016 to 2025, including hail two inches or larger, and the largest stone recorded.
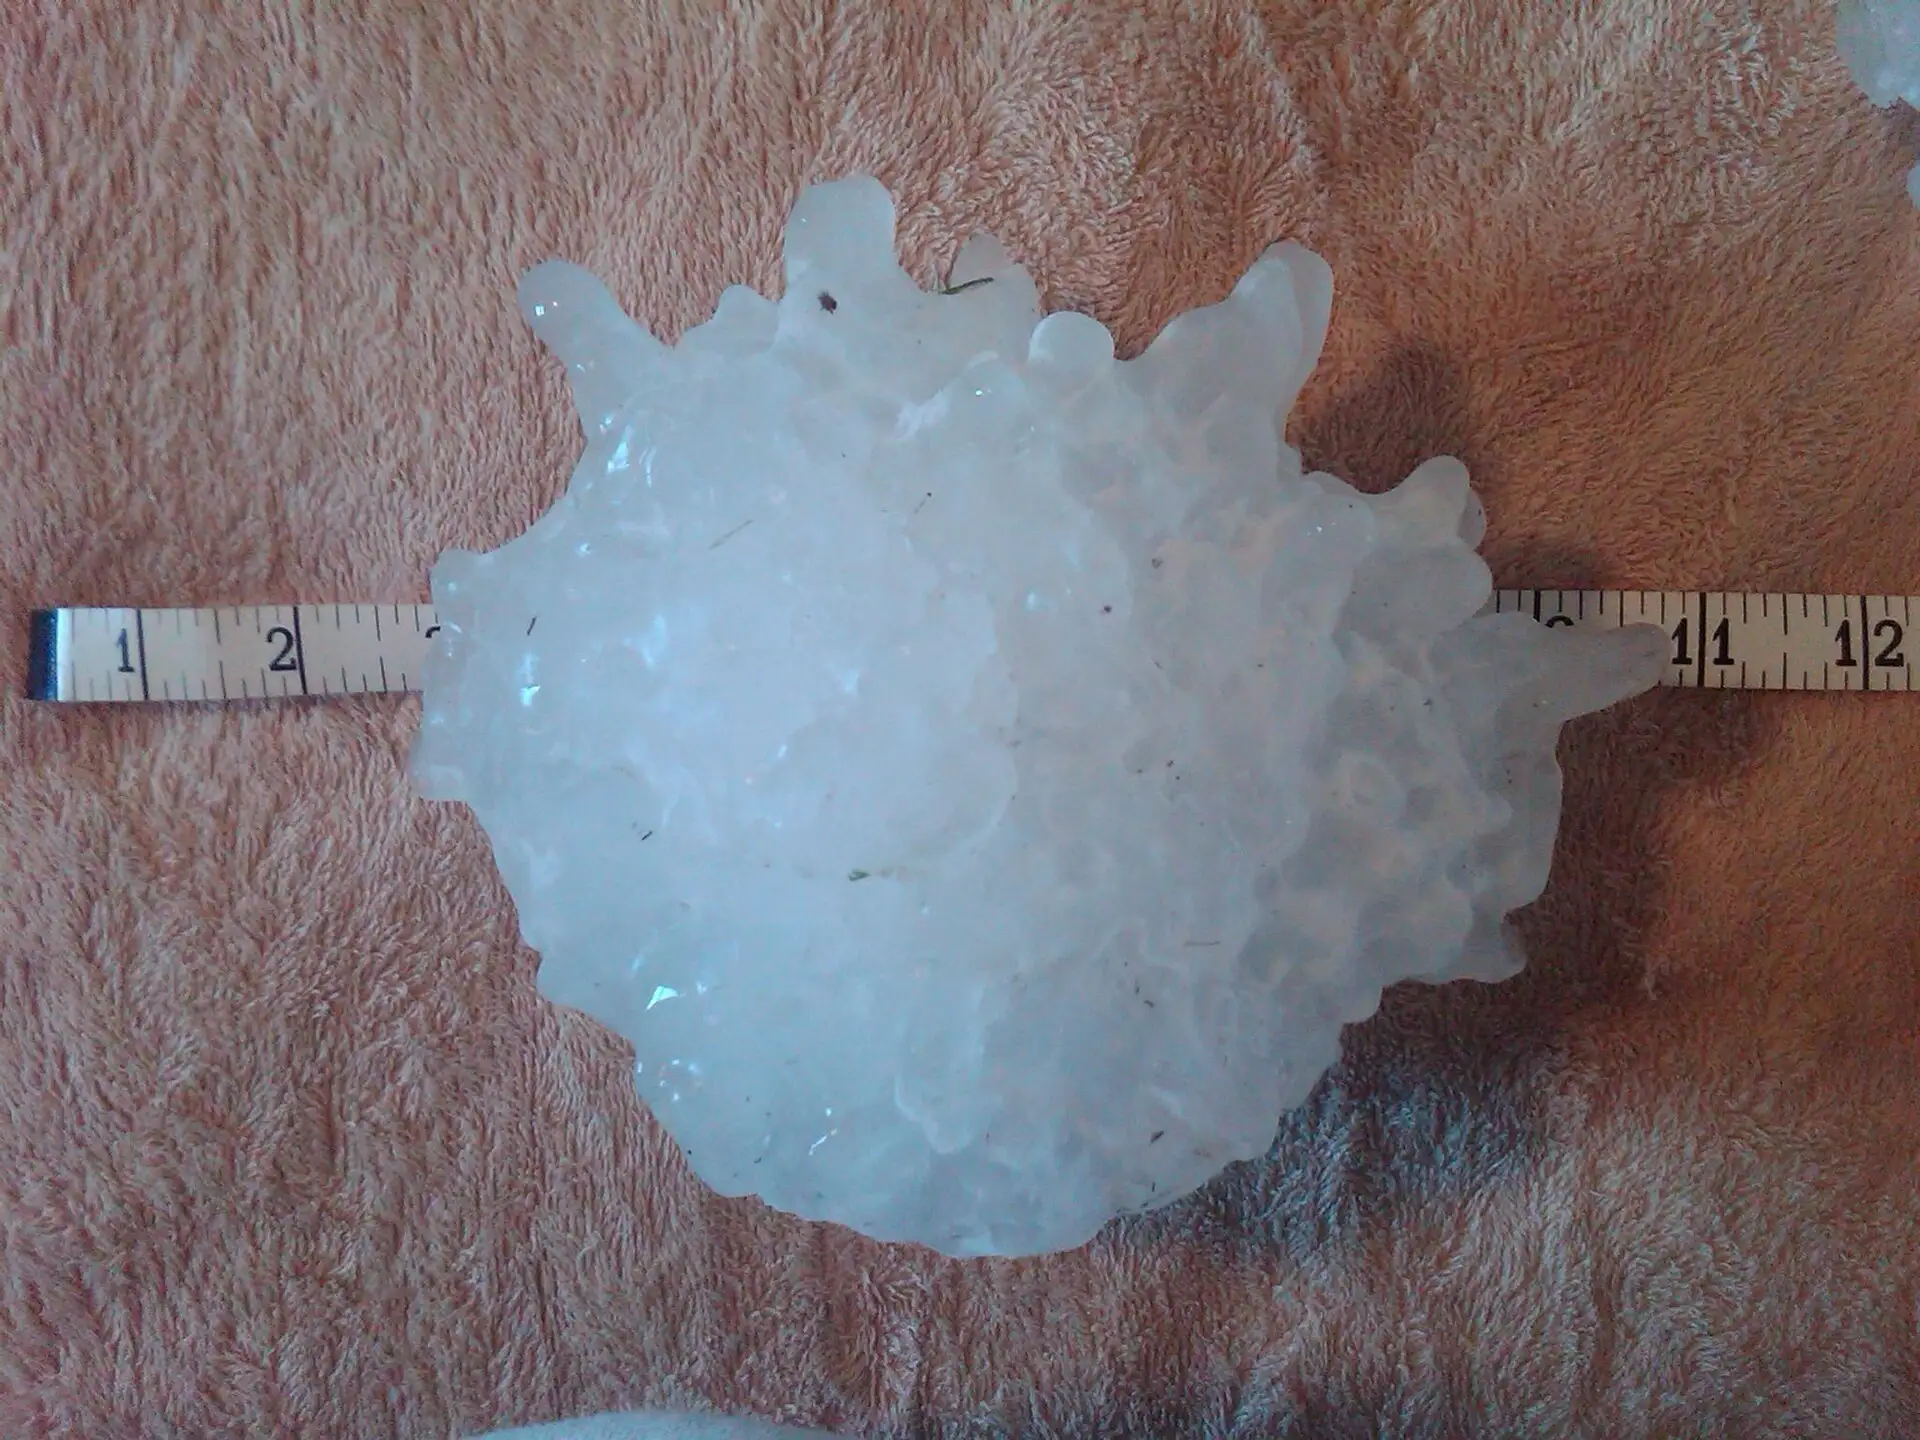
Photo: the hailstone that set the U.S. record for diameter, Vivian, South Dakota, July 2010. National Weather Service, Aberdeen, South Dakota, public domain. Use does not imply endorsement.

Texas ranks first with 12,919, followed by Kansas (7,353) and Oklahoma (5,409).
The top five states account for 41% of the national total.
The top ten
All states, ranked
| Rank | State | Hail reports | 2 inches or larger | Largest reported | Reported damage |
|---|---|---|---|---|---|
| 1 | Texas | 12,919 | 1,986 | 7.02 in | $6.8 billion |
| 2 | Kansas | 7,353 | 838 | 5 in | $19.0 million |
| 3 | Oklahoma | 5,409 | 678 | 6 in | $19.0 million |
| 4 | Nebraska | 5,338 | 679 | 6 in | $233 million |
| 5 | Colorado | 4,491 | 583 | 5.25 in | $2.9 billion |
| 6 | South Dakota | 4,278 | 413 | 4.5 in | $2.6 million |
| 7 | Missouri | 3,944 | 343 | 5 in | $85.2 million |
| 8 | Minnesota | 3,845 | 355 | 6 in | $34.5 million |
| 9 | Iowa | 3,386 | 270 | 4 in | $3.4 million |
| 10 | Illinois | 2,878 | 196 | 4.5 in | $25.9 million |
| 11 | North Dakota | 2,453 | 235 | 4.5 in | $115 million |
| 12 | Wisconsin | 2,376 | 171 | 4.5 in | $57.7 million |
| 13 | Arkansas | 2,011 | 208 | 5 in | $7.4 million |
| 14 | Montana | 1,850 | 186 | 4 in | $4.1 million |
| 15 | Wyoming | 1,614 | 147 | 4.5 in | $5.4 million |
| 16 | Tennessee | 1,585 | 81 | 4 in | $535,500 |
| 17 | Ohio | 1,584 | 64 | 3.5 in | $558,100 |
| 18 | North Carolina | 1,466 | 63 | 4 in | $113 million |
| 19 | Indiana | 1,456 | 109 | 4 in | $1.6 million |
| 20 | New Mexico | 1,417 | 126 | 4 in | $17.1 million |
| 21 | Mississippi | 1,318 | 94 | 4.88 in | $90.0 million |
| 22 | Kentucky | 1,315 | 86 | 4.5 in | $4.5 million |
| 23 | Pennsylvania | 1,308 | 48 | 4 in | $2.6 million |
| 24 | Alabama | 1,237 | 117 | 5.38 in | $5,000 |
| 25 | Virginia | 1,193 | 55 | 4 in | $1.3 million |
| 26 | Louisiana | 1,147 | 83 | 4 in | $49.3 million |
| 27 | Georgia | 1,142 | 38 | 4 in | $44.3 million |
| 28 | South Carolina | 1,092 | 36 | 3 in | $25.0 million |
| 29 | Florida | 900 | 42 | 3 in | $564,600 |
| 30 | Michigan | 845 | 63 | 4 in | $43.9 million |
| 31 | New York | 775 | 29 | 3 in | $20.2 million |
| 32 | West Virginia | 702 | 35 | 4.25 in | $6.3 million |
| 33 | Maryland | 388 | 20 | 4 in | $203,000 |
| 34 | New Jersey | 356 | 6 | 2.5 in | $0 |
| 35 | Arizona | 351 | 9 | 2.75 in | $3.4 million |
| 36 | California | 318 | 3 | 3 in | $20.6 million |
| 37 | New Hampshire | 257 | 2 | 2 in | $17,100 |
| 38 | Massachusetts | 256 | 3 | 2 in | $0 |
| 39 | Idaho | 219 | 7 | 2.75 in | $30.2 million |
| 40 | Maine | 194 | 3 | 2.5 in | $1.2 million |
| 41 | Utah | 151 | 1 | 2 in | $318,000 |
| 42 | Oregon | 141 | 7 | 2.5 in | $50,000 |
| 43 | Connecticut | 102 | 2 | 2.5 in | $75,000 |
| 44 | Vermont | 92 | 0 | 1.75 in | $89,000 |
| 45 | Nevada | 60 | 1 | 2 in | $55.6 million |
| 46 | Washington | 55 | 2 | 2.75 in | $220,200 |
| 47 | Delaware | 48 | 2 | 2.25 in | $0 |
| 48 | Rhode Island | 24 | 0 | 1.75 in | $0 |
| 49 | District of Columbia | 19 | 0 | 1.75 in | $0 |
| 50 | Alaska | 5 | 0 | 1 in | $0 |
| 51 | Hawaii | 2 | 0 | 1.25 in | $0 |
What this measures
Hail events recorded by the National Weather Service. The Service logs hail of three-quarters of an inch or larger.
- A report is one hail event in one county; a single storm can produce many reports.
- Hail that falls where nobody reports it is not counted, so busy and populated areas log more.
- Damage estimates are missing from many hail reports.
More rankings
Use this data
You are welcome to quote these figures and reuse the charts in news stories, research and blog posts. Please credit the page with a link.
PublicAdjuster.cc, "Hail by state, 2016–2025," https://publicadjuster.cc/data/hail-by-state/. Compiled from the NOAA Storm Events Database and FEMA OpenFEMA data, November 10, 2026.
Download all states (CSV) How the figures are built
The underlying records are published by NOAA, FEMA and the U.S. Census Bureau. This product uses the FEMA OpenFEMA API, but is not endorsed by FEMA. The Federal Government or FEMA cannot vouch for the data or analyses derived from these data after the data have been retrieved from the Agency's website(s).