Tornadoes by state, 2016–2025
Tornado reports in each state, 2016 to 2025, with the number rated EF2 or stronger and the reported property damage.
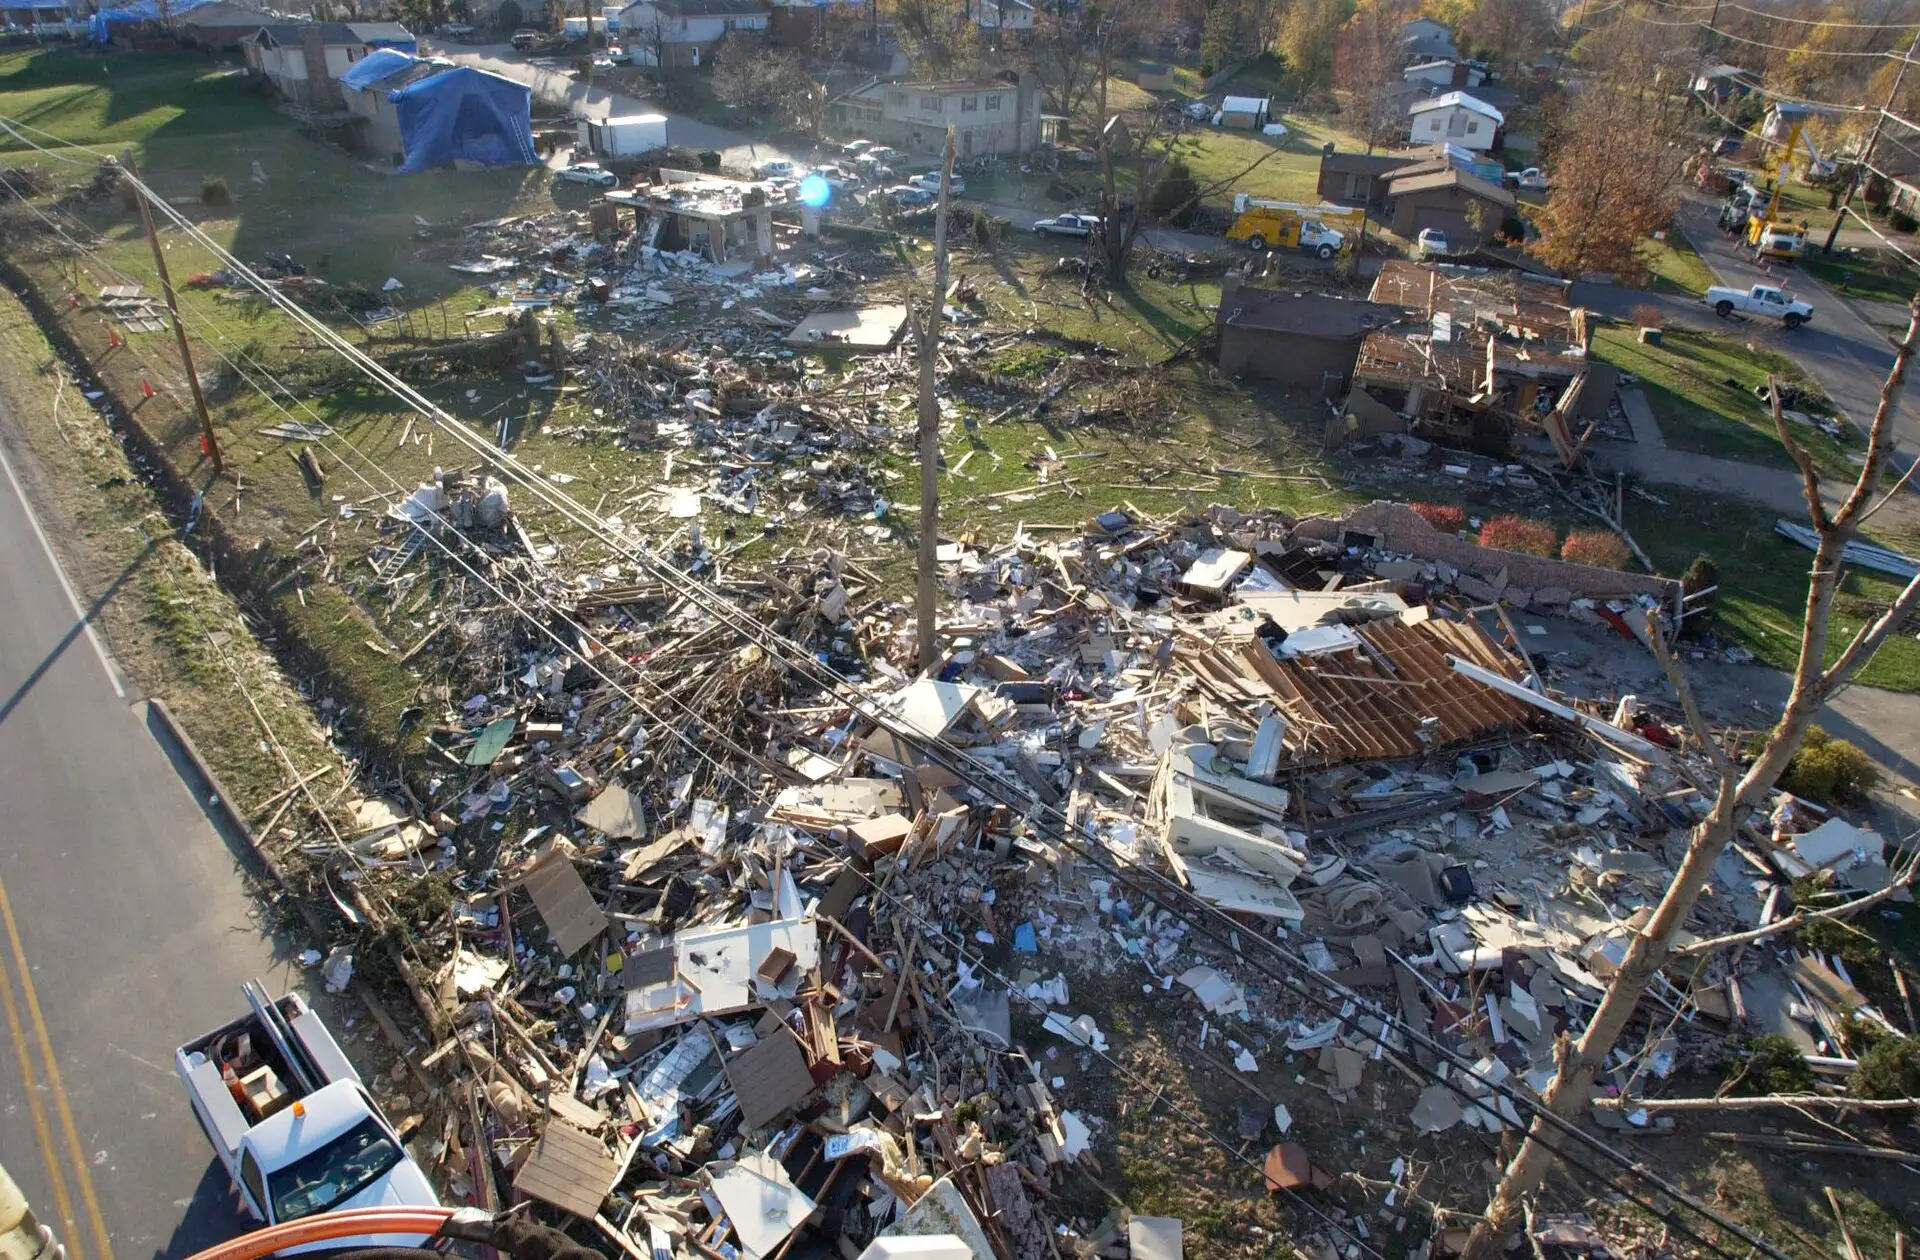
Photo: a neighbourhood in Newburgh, Indiana, after a tornado, November 2005. Leif Skoogfors / FEMA, public domain. Use does not imply endorsement.

Texas ranks first with 1,244, followed by Mississippi (1,039) and Oklahoma (948).
The top five states account for 33% of the national total. Hawaii recorded none.
The top ten
All states, ranked
| Rank | State | Tornado reports | EF2 or stronger | Strongest | Reported damage |
|---|---|---|---|---|---|
| 1 | Texas | 1,244 | 183 | EF4 | $2.2 billion |
| 2 | Mississippi | 1,039 | 160 | EF4 | $548 million |
| 3 | Oklahoma | 948 | 89 | EF4 | $561 million |
| 4 | Illinois | 875 | 75 | EF4 | $198 million |
| 5 | Alabama | 861 | 126 | EF4 | $48.4 million |
| 6 | Iowa | 759 | 99 | EF4 | $627 million |
| 7 | Louisiana | 683 | 102 | EF3 | $635 million |
| 8 | Georgia | 612 | 75 | EF4 | $388 million |
| 9 | Missouri | 596 | 81 | EF4 | $1.9 billion |
| 10 | Kansas | 593 | 65 | EF4 | $101 million |
| 11 | Florida | 558 | 48 | EF3 | $1.0 billion |
| 12 | Minnesota | 550 | 28 | EF4 | $43.7 million |
| 13 | Nebraska | 484 | 51 | EF4 | $36.6 million |
| 14 | Arkansas | 445 | 75 | EF3 | $741 million |
| 15 | Ohio | 422 | 48 | EF4 | $661 million |
| 16 | Colorado | 414 | 23 | EF3 | $2.7 million |
| 17 | Kentucky | 397 | 57 | EF4 | $64.8 million |
| 18 | Tennessee | 395 | 71 | EF4 | $1.9 billion |
| 19 | Indiana | 381 | 60 | EF3 | $123 million |
| 20 | North Carolina | 330 | 26 | EF3 | $445 million |
| 21 | Wisconsin | 330 | 22 | EF3 | $82.2 million |
| 22 | South Carolina | 312 | 36 | EF4 | $125 million |
| 23 | North Dakota | 266 | 24 | EF5 | $17.0 million |
| 24 | Pennsylvania | 253 | 33 | EF3 | $40.3 million |
| 25 | South Dakota | 201 | 25 | EF3 | $19.4 million |
| 26 | Virginia | 175 | 21 | EF3 | $113 million |
| 27 | Michigan | 147 | 9 | EF3 | $229 million |
| 28 | New Mexico | 116 | 3 | EF2 | $5.1 million |
| 29 | New York | 112 | 8 | EF3 | $12.0 million |
| 30 | Wyoming | 102 | 15 | EF3 | $952,000 |
| 31 | Maryland | 76 | 7 | EF2 | $48.9 million |
| 32 | California | 63 | 1 | EF2 | $695,610 |
| 33 | Arizona | 58 | 0 | EF1 | $965,000 |
| 34 | New Jersey | 55 | 8 | EF3 | $5.5 million |
| 35 | West Virginia | 42 | 4 | EF2 | $3.5 million |
| 36 | Montana | 38 | 3 | EF3 | $1.5 million |
| 37 | Massachusetts | 37 | 0 | EF1 | $11.9 million |
| 38 | Connecticut | 31 | 0 | EF1 | $1.3 million |
| 39 | Oregon | 28 | 1 | EF2 | $1.5 million |
| 40 | Washington | 22 | 1 | EF2 | $1.4 million |
| 41 | Idaho | 20 | 0 | EF1 | $14,500 |
| 42 | Utah | 19 | 3 | EF2 | $2.3 million |
| 43 | Delaware | 17 | 4 | EF3 | $0 |
| 44 | New Hampshire | 13 | 0 | EF1 | $94,000 |
| 45 | Maine | 11 | 0 | EF1 | $4,000 |
| 46 | Nevada | 10 | 0 | EF1 | $20,000 |
| 47 | Rhode Island | 9 | 1 | EF2 | $1.4 million |
| 48 | Vermont | 5 | 0 | EF1 | $135,000 |
| 49 | District of Columbia | 4 | 0 | EF1 | $200,000 |
| 50 | Alaska | 1 | 0 | EF0 | $0 |
| 51 | Hawaii | 0 | 0 | — | $0 |
What this measures
Tornado segments recorded by the National Weather Service, with their Enhanced Fujita rating.
- A tornado that crosses a county line is recorded as one segment per county, so segments outnumber tornadoes.
- Ratings are assigned from damage surveys; a tornado over open country may be rated lower than its true strength.
More rankings
Use this data
You are welcome to quote these figures and reuse the charts in news stories, research and blog posts. Please credit the page with a link.
PublicAdjuster.cc, "Tornadoes by state, 2016–2025," https://publicadjuster.cc/data/tornadoes-by-state/. Compiled from the NOAA Storm Events Database and FEMA OpenFEMA data, November 10, 2026.
Download all states (CSV) How the figures are built
The underlying records are published by NOAA, FEMA and the U.S. Census Bureau. This product uses the FEMA OpenFEMA API, but is not endorsed by FEMA. The Federal Government or FEMA cannot vouch for the data or analyses derived from these data after the data have been retrieved from the Agency's website(s).